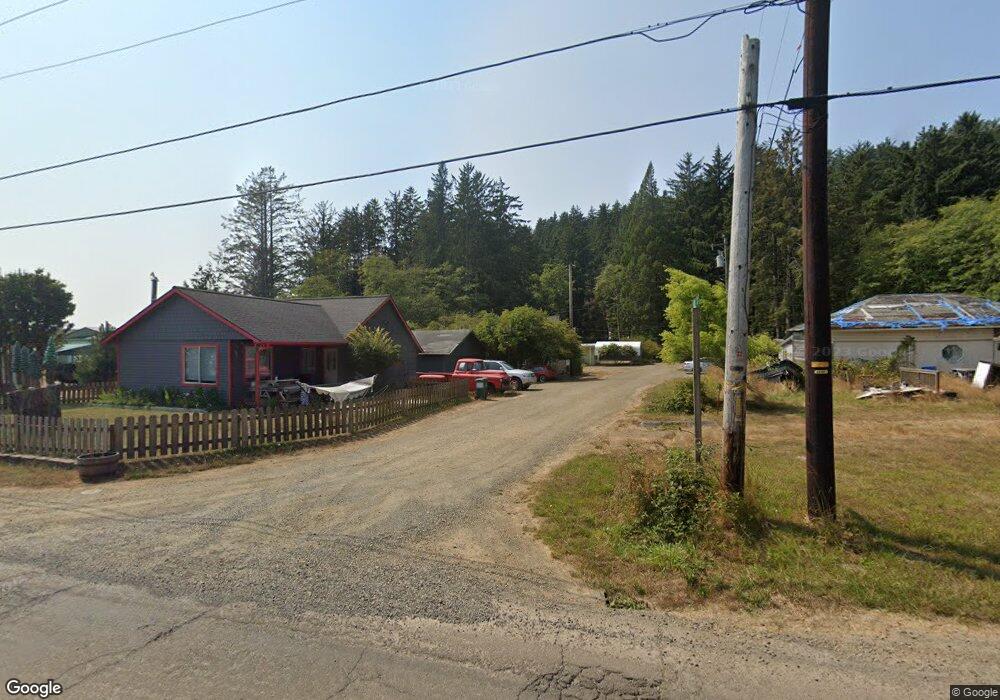
6975 Virgil St Cloverdale, OR 97112
Estimated Value: $315,000 - $470,000
3
Beds
1
Bath
704
Sq Ft
$530/Sq Ft
Est. Value
About This Home
This home is located at 6975 Virgil St, Cloverdale, OR 97112 and is currently estimated at $373,415, approximately $530 per square foot. 6975 Virgil St is a home located in Tillamook County with nearby schools including Nestucca K-8 School and Nestucca High School.
Ownership History
Date
Name
Owned For
Owner Type
Purchase Details
Closed on
May 10, 2016
Sold by
Albert Brian D
Bought by
Lundy Beverly and Applebee Terrance S
Current Estimated Value
Home Financials for this Owner
Home Financials are based on the most recent Mortgage that was taken out on this home.
Original Mortgage
$40,000
Interest Rate
3.71%
Mortgage Type
Seller Take Back
Purchase Details
Closed on
Dec 28, 1998
Sold by
The State Of Oregon
Bought by
Albert Brian D
Create a Home Valuation Report for This Property
The Home Valuation Report is an in-depth analysis detailing your home's value as well as a comparison with similar homes in the area
Home Values in the Area
Average Home Value in this Area
Purchase History
| Date | Buyer | Sale Price | Title Company |
|---|---|---|---|
| Lundy Beverly | $100,000 | Ticor Title Company Of Or | |
| Albert Brian D | $30,000 | None Available |
Source: Public Records
Mortgage History
| Date | Status | Borrower | Loan Amount |
|---|---|---|---|
| Closed | Lundy Beverly | $40,000 |
Source: Public Records
Tax History Compared to Growth
Tax History
| Year | Tax Paid | Tax Assessment Tax Assessment Total Assessment is a certain percentage of the fair market value that is determined by local assessors to be the total taxable value of land and additions on the property. | Land | Improvement |
|---|---|---|---|---|
| 2024 | $1,370 | $112,820 | $35,290 | $77,530 |
| 2023 | $1,361 | $109,540 | $34,260 | $75,280 |
| 2022 | $1,313 | $106,350 | $33,260 | $73,090 |
| 2021 | $1,282 | $103,260 | $32,290 | $70,970 |
| 2020 | $1,252 | $100,260 | $31,350 | $68,910 |
| 2019 | $1,224 | $97,340 | $30,440 | $66,900 |
| 2018 | $1,124 | $94,510 | $29,550 | $64,960 |
| 2017 | $1,028 | $91,760 | $28,690 | $63,070 |
| 2016 | $1,011 | $89,090 | $27,850 | $61,240 |
| 2015 | $988 | $86,500 | $27,040 | $59,460 |
| 2014 | $968 | $83,990 | $26,250 | $57,740 |
| 2013 | -- | $81,550 | $25,490 | $56,060 |
Source: Public Records
Map
Nearby Homes
- 33480 Ferry St
- 6930 Parker St
- 6925 Parker St
- 34475 Brooten Rd
- 34850 Resort Dr
- 0 Dory Pointe Loop Unit TL8100 229390931
- TL8100 Dory Pointe Loop
- 6415 Dory Pointe Loop
- 34700 Hill St
- 5904 Barefoot Ln
- 33495 Cape Kiwanda Dr
- 5950 Neptune Dr
- 33520 Cape Kiwanda Dr
- TL 2714 Tent St
- 33515 Madrona Dr
- 5930 Summerhouse Ln
- 34320 Cape Kiwanda Dr
- 5685 Barefoot Ln
- 12 Cape Kiwanda Dr
- 4 Reddekopp Rd