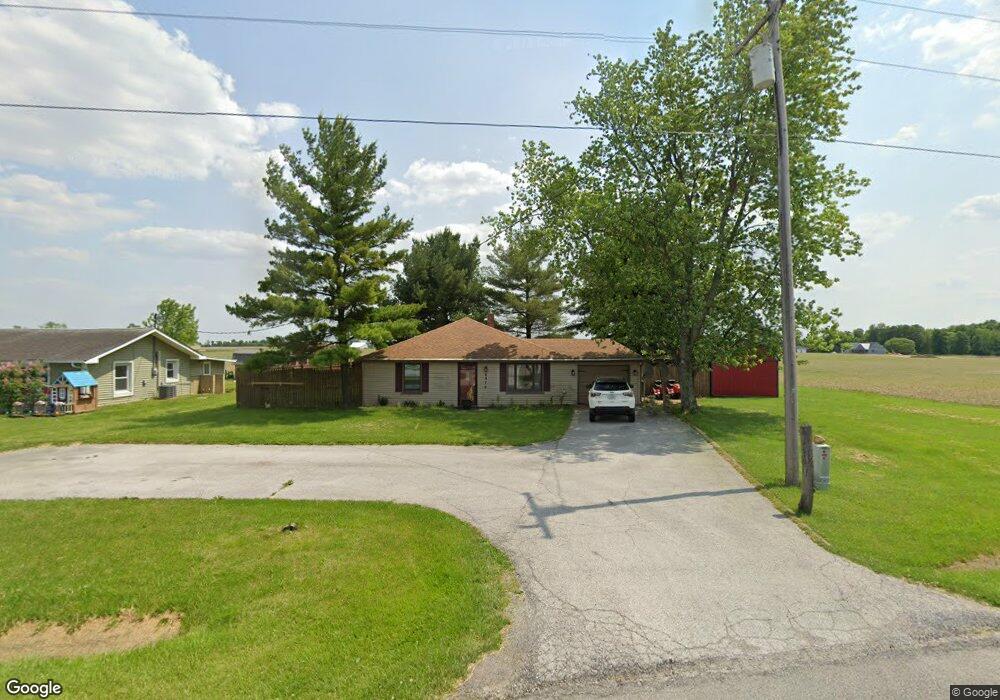
6976 E Us Highway 40 Fillmore, IN 46128
Estimated Value: $163,094 - $222,000
2
Beds
1
Bath
1,656
Sq Ft
$118/Sq Ft
Est. Value
About This Home
This home is located at 6976 E Us Highway 40, Fillmore, IN 46128 and is currently estimated at $195,024, approximately $117 per square foot. 6976 E Us Highway 40 is a home located in Putnam County with nearby schools including South Putnam High School.
Ownership History
Date
Name
Owned For
Owner Type
Purchase Details
Closed on
Dec 29, 2020
Sold by
Ratliff Michael
Bought by
Ratliff Michael and Ratliff Melinda
Current Estimated Value
Purchase Details
Closed on
Oct 26, 2020
Sold by
App Levi P and App Samantha J
Bought by
Ratliff Michael
Home Financials for this Owner
Home Financials are based on the most recent Mortgage that was taken out on this home.
Original Mortgage
$127,645
Outstanding Balance
$113,586
Interest Rate
2.8%
Mortgage Type
FHA
Estimated Equity
$81,438
Purchase Details
Closed on
Jul 12, 2018
Sold by
Cash Kenda
Bought by
App Levi P
Purchase Details
Closed on
Dec 23, 2016
Sold by
Hewitt Christina R
Bought by
Cash Kenda
Home Financials for this Owner
Home Financials are based on the most recent Mortgage that was taken out on this home.
Original Mortgage
$56,000
Interest Rate
4.03%
Mortgage Type
New Conventional
Create a Home Valuation Report for This Property
The Home Valuation Report is an in-depth analysis detailing your home's value as well as a comparison with similar homes in the area
Home Values in the Area
Average Home Value in this Area
Purchase History
| Date | Buyer | Sale Price | Title Company |
|---|---|---|---|
| Ratliff Michael | -- | Security Title | |
| Ratliff Michael | $130,000 | Security Title | |
| App Levi P | -- | None Available | |
| Cash Kenda | -- | None Available |
Source: Public Records
Mortgage History
| Date | Status | Borrower | Loan Amount |
|---|---|---|---|
| Open | Ratliff Michael | $127,645 | |
| Previous Owner | Cash Kenda | $56,000 |
Source: Public Records
Tax History Compared to Growth
Tax History
| Year | Tax Paid | Tax Assessment Tax Assessment Total Assessment is a certain percentage of the fair market value that is determined by local assessors to be the total taxable value of land and additions on the property. | Land | Improvement |
|---|---|---|---|---|
| 2024 | $400 | $93,400 | $8,100 | $85,300 |
| 2023 | $289 | $82,200 | $8,100 | $74,100 |
| 2022 | $280 | $79,900 | $5,800 | $74,100 |
| 2021 | $223 | $72,800 | $5,800 | $67,000 |
| 2020 | $199 | $65,200 | $5,800 | $59,400 |
| 2019 | $241 | $65,200 | $5,800 | $59,400 |
| 2018 | $193 | $65,200 | $5,800 | $59,400 |
| 2017 | $177 | $67,700 | $5,800 | $61,900 |
| 2016 | $120 | $54,600 | $5,800 | $48,800 |
| 2014 | -- | $57,200 | $5,800 | $51,400 |
| 2013 | -- | $57,200 | $5,800 | $51,400 |
Source: Public Records
Map
Nearby Homes
- 3319 S County Road 825 E
- 4005 S Co Road 510 E
- 5012 E County Road 400 S
- 6192 S County Road 550 E
- 4209 E County Road 50 S
- 0 250 E
- 222 Westwood Rd
- 125 N Main St
- 1747 E Tall Oaks Ln
- 125 Woodland Heights
- 190 Lincoln Hills
- 7798 S County Road 950 E
- 6188 South St
- 6138 Clinton St
- 7952 E County Road 850 S
- 6015 Indiana 75
- 6913 E County Road 200 N
- 8120 W County Road 150 S
- 5378 S State Road 75
- 8083 Walnut St
- 6976 U S 40
- 6990 E Us Highway 40
- 6845 E Us Highway 40
- 6874 E Us Highway 40
- 6826 E Us Highway 40
- 32 Lazy Acres Estate
- 24 Lazy Acres Estate
- 24 Lazy Acres Estate
- 6774 E Us Highway 40
- 10 Lazy Acres Estate Unit ES
- 10 Lazy Acres Estate
- 34 Lazy Acres Estate
- 23 Lazy Acres Estate
- 34 Lazy Acres Estates
- 23 Lazy Acres Estate
- 12 Lazy Acres Estates
- 12 Lazy Acres Estate
- 6730 E Us Highway 40
- 13 Lazy Acres Estate
- 6712 E Us Highway 40