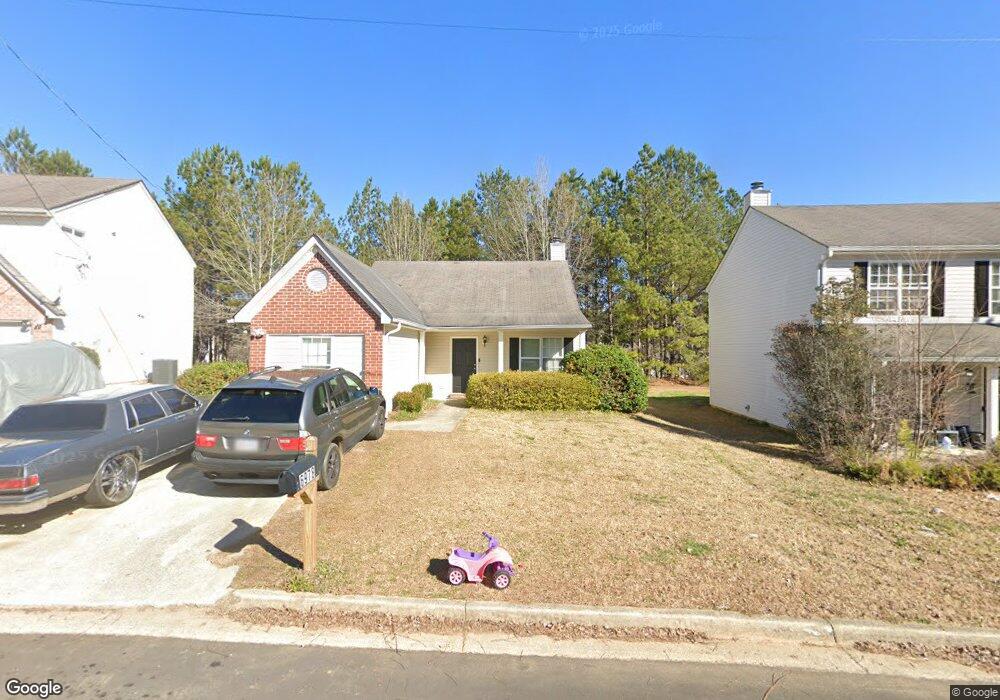
6978 Red Bone Way Unit 1 Lithonia, GA 30038
Estimated Value: $225,000 - $239,000
4
Beds
2
Baths
1,590
Sq Ft
$147/Sq Ft
Est. Value
About This Home
This home is located at 6978 Red Bone Way Unit 1, Lithonia, GA 30038 and is currently estimated at $233,286, approximately $146 per square foot. 6978 Red Bone Way Unit 1 is a home located in DeKalb County with nearby schools including Murphy Candler Elementary School, Salem Middle School, and Martin Luther King- Jr. High School.
Ownership History
Date
Name
Owned For
Owner Type
Purchase Details
Closed on
Jul 22, 2016
Sold by
Starwood Waypoint Trs Llc
Bought by
Gordon Cedric
Current Estimated Value
Home Financials for this Owner
Home Financials are based on the most recent Mortgage that was taken out on this home.
Original Mortgage
$76,800
Outstanding Balance
$61,051
Interest Rate
3.45%
Estimated Equity
$172,235
Purchase Details
Closed on
Jul 14, 2015
Sold by
Tarbert Llc
Bought by
Starwood Waypoint Trs Llc
Purchase Details
Closed on
Jun 30, 2014
Sold by
Srp Sub Llc
Bought by
Tarbert Llc
Purchase Details
Closed on
Jun 4, 2013
Sold by
Mcrae Zondra
Bought by
Srp Sub Llc
Purchase Details
Closed on
Sep 27, 2001
Sold by
Mayfield Homes Llc
Bought by
Mcrae Zondra
Home Financials for this Owner
Home Financials are based on the most recent Mortgage that was taken out on this home.
Original Mortgage
$123,754
Interest Rate
6.54%
Mortgage Type
FHA
Create a Home Valuation Report for This Property
The Home Valuation Report is an in-depth analysis detailing your home's value as well as a comparison with similar homes in the area
Home Values in the Area
Average Home Value in this Area
Purchase History
| Date | Buyer | Sale Price | Title Company |
|---|---|---|---|
| Gordon Cedric | $96,000 | -- | |
| Starwood Waypoint Trs Llc | -- | -- | |
| Tarbert Llc | -- | -- | |
| Srp Sub Llc | $75,000 | -- | |
| Mcrae Zondra | $125,700 | -- |
Source: Public Records
Mortgage History
| Date | Status | Borrower | Loan Amount |
|---|---|---|---|
| Open | Gordon Cedric | $76,800 | |
| Previous Owner | Mcrae Zondra | $123,754 |
Source: Public Records
Tax History Compared to Growth
Tax History
| Year | Tax Paid | Tax Assessment Tax Assessment Total Assessment is a certain percentage of the fair market value that is determined by local assessors to be the total taxable value of land and additions on the property. | Land | Improvement |
|---|---|---|---|---|
| 2025 | $4,643 | $93,920 | $18,000 | $75,920 |
| 2024 | $4,546 | $92,440 | $18,000 | $74,440 |
| 2023 | $4,546 | $91,720 | $18,000 | $73,720 |
| 2022 | $3,733 | $77,360 | $7,240 | $70,120 |
| 2021 | $2,916 | $57,880 | $7,240 | $50,640 |
| 2020 | $2,593 | $51,160 | $7,240 | $43,920 |
| 2019 | $2,362 | $46,240 | $7,240 | $39,000 |
| 2018 | $1,835 | $39,200 | $7,240 | $31,960 |
| 2017 | $1,960 | $36,920 | $7,240 | $29,680 |
| 2016 | $1,695 | $30,840 | $7,240 | $23,600 |
| 2014 | $1,800 | $32,400 | $7,240 | $25,160 |
Source: Public Records
Map
Nearby Homes
- 7023 Setters Way
- 7012 Setters Way
- 7056 Mahonia Place
- 7037 Mahonia Place
- 4741 Bob White Run
- 7134 Ravenwood Ln
- 6874 Mahonia Place
- 6837 Mahonia Place
- 6731 Browns Mill Trail
- 7078 Ravenwood Ln
- 7074 Ravenwood Ln
- 7069 Ravenwood Ln
- 4647 Lantern Ct
- 4273 Chestnut Lake Ave
- 4719 Browns Mill Dr
- 7144 Browns Mill Rd
- 7134 Browns Mill Rd
- 7126 Browns Mill Rd
- 7100 Browns Mill Rd
- 5009 Lynnonhall Ct
- 6978 Red Bone Way
- 6982 Red Bone Way
- 6976 Red Bone Way
- 6986 Red Bone Way
- 6972 Red Bone Way
- 7079 Mahonia Place
- 7075 Mahonia Place
- 7083 Mahonia Place
- 7093 Mahonia Place
- 7071 Mahonia Place
- 6968 Red Bone Way
- 6968 Red Bone Way Unit 1
- 7097 Mahonia Place
- 6977 Red Bone Way Unit 33
- 6977 Red Bone Way
- 6981 Red Bone Way
- 6981 Red Bone Way Unit 6981
- 6971 Red Bone Way
- 7065 Mahonia Place
- 6985 Red Bone Way