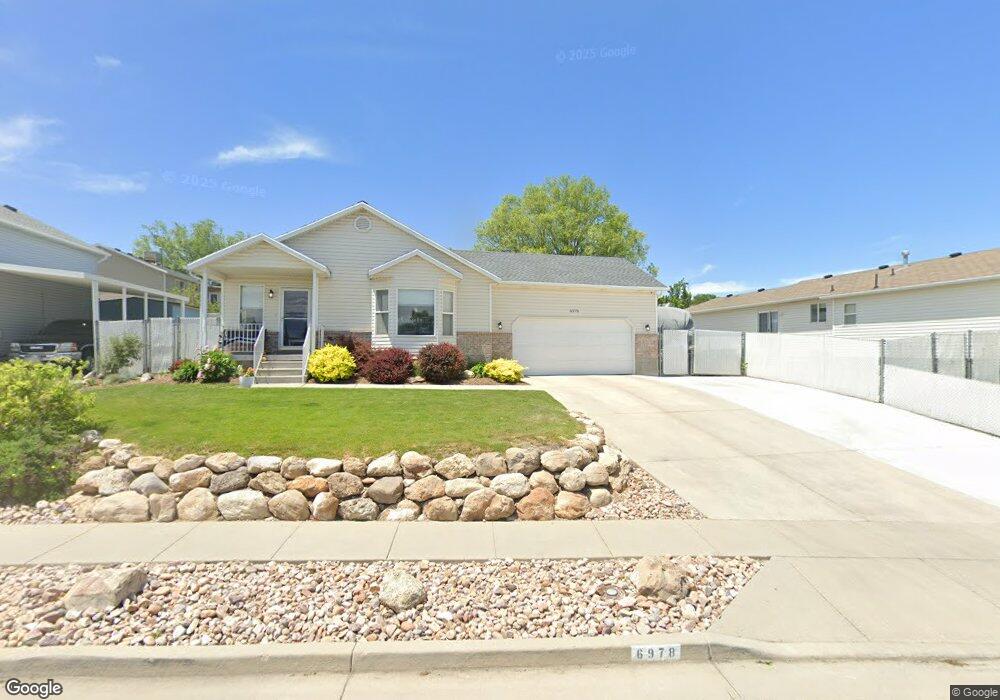
6978 S Oquirrh Ridge Rd West Jordan, UT 84081
Oquirrh NeighborhoodEstimated Value: $451,000 - $488,000
3
Beds
2
Baths
1,115
Sq Ft
$424/Sq Ft
Est. Value
About This Home
This home is located at 6978 S Oquirrh Ridge Rd, West Jordan, UT 84081 and is currently estimated at $472,249, approximately $423 per square foot. 6978 S Oquirrh Ridge Rd is a home located in Salt Lake County with nearby schools including Falcon Ridge School, Sunset Ridge Middle School, and Copper Hills High School.
Ownership History
Date
Name
Owned For
Owner Type
Purchase Details
Closed on
Apr 21, 2009
Sold by
Taylor David C and Taylor Gaylynn
Bought by
Taylor David and Taylor Gaylynn
Current Estimated Value
Home Financials for this Owner
Home Financials are based on the most recent Mortgage that was taken out on this home.
Original Mortgage
$128,500
Interest Rate
4.64%
Mortgage Type
New Conventional
Purchase Details
Closed on
Feb 26, 2003
Sold by
Taylor David C and Robinson Gaylynn
Bought by
Taylor David C and Taylor Gaylynn
Home Financials for this Owner
Home Financials are based on the most recent Mortgage that was taken out on this home.
Original Mortgage
$145,000
Interest Rate
5.93%
Purchase Details
Closed on
Feb 3, 2000
Sold by
Reliance Homes Inc
Bought by
Taylor David C and Robinson Gaylynn
Home Financials for this Owner
Home Financials are based on the most recent Mortgage that was taken out on this home.
Original Mortgage
$128,200
Interest Rate
7.96%
Create a Home Valuation Report for This Property
The Home Valuation Report is an in-depth analysis detailing your home's value as well as a comparison with similar homes in the area
Home Values in the Area
Average Home Value in this Area
Purchase History
| Date | Buyer | Sale Price | Title Company |
|---|---|---|---|
| Taylor David | -- | Meridian Title | |
| Taylor David C | -- | Meridian Title | |
| Taylor David C | -- | Merrill Title |
Source: Public Records
Mortgage History
| Date | Status | Borrower | Loan Amount |
|---|---|---|---|
| Closed | Taylor David | $128,500 | |
| Closed | Taylor David C | $145,000 | |
| Closed | Taylor David C | $128,200 |
Source: Public Records
Tax History Compared to Growth
Tax History
| Year | Tax Paid | Tax Assessment Tax Assessment Total Assessment is a certain percentage of the fair market value that is determined by local assessors to be the total taxable value of land and additions on the property. | Land | Improvement |
|---|---|---|---|---|
| 2025 | $2,518 | $446,500 | $152,400 | $294,100 |
| 2024 | $2,518 | $425,700 | $146,500 | $279,200 |
| 2023 | $2,518 | $402,600 | $140,900 | $261,700 |
| 2022 | $2,647 | $417,900 | $138,200 | $279,700 |
| 2021 | $2,312 | $338,800 | $106,300 | $232,500 |
| 2020 | $2,189 | $299,700 | $98,600 | $201,100 |
| 2019 | $2,141 | $286,600 | $93,000 | $193,600 |
| 2018 | $1,988 | $262,700 | $93,000 | $169,700 |
| 2017 | $1,907 | $248,300 | $93,000 | $155,300 |
| 2016 | $1,944 | $238,100 | $86,100 | $152,000 |
| 2015 | $1,715 | $202,600 | $92,600 | $110,000 |
| 2014 | $1,678 | $194,800 | $89,700 | $105,100 |
Source: Public Records
Map
Nearby Homes
- 6116 W Graceland Way
- 6969 S High Bluff Dr
- 5882 W 7000 S
- 6778 Turnstone Ct
- 6806 Duchess St
- 6123 August Ln
- 6995 Tourist Ln Unit 7
- 6761 S High Bluff Dr
- 6298 W Liza Ln
- 5961 W Chiswick Ct
- 6341 Passenger Ln Unit 4
- 6328 W Traveler Ln
- 6705 S High Bluff Dr
- 6680 S Leichen Ct
- 6364 W Passenger Ln
- 5818 W Whisper View Ct Unit 336
- 6671 S Oakshade Ln
- 7134 S Rialto Way
- 6838 Discovery Ct
- 6739 S Sol Rise Dr
- 6964 S Oquirrh Ridge Rd
- 6051 W Oquirrh Ridge Ct
- 6988 S Oquirrh Ridge Rd
- 6988 Oquirrh Ridge
- 6985 S Oquirrh Ridge Rd
- 6029 Jackling Way
- 6066 W 7000 S
- 6069 W Oquirrh Ridge Ct
- 6069 W Oquirrh Ridge Ct Unit 250
- 6020 W 7000 S
- 6048 W Oquirrh Ridge Ct
- 6060 W Oquirrh Ridge Ct
- 6082 W 7000 S
- 6013 W Jackling Way
- 6013 Jackling Way
- 6026 Jackling Way
- 6079 W Oquirrh Ridge Ct
- 6008 W 7000 S
- 6070 W Oquirrh Ridge Ct
- 6041 W Miners Mesa Dr