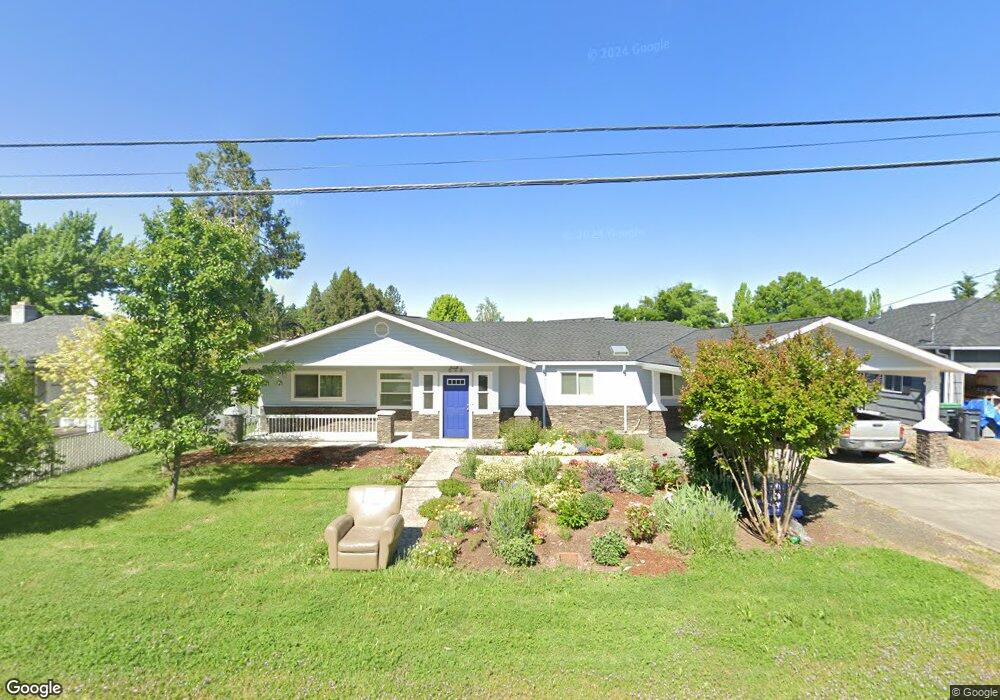
698 S Modoc Ave Medford, OR 97504
Estimated Value: $409,000 - $443,000
4
Beds
2
Baths
1,353
Sq Ft
$320/Sq Ft
Est. Value
About This Home
This home is located at 698 S Modoc Ave, Medford, OR 97504 and is currently estimated at $432,662, approximately $319 per square foot. 698 S Modoc Ave is a home located in Jackson County with nearby schools including Hoover Elementary School, Hedrick Middle School, and South Medford High School.
Ownership History
Date
Name
Owned For
Owner Type
Purchase Details
Closed on
Sep 23, 2015
Sold by
Winters Catherine M and Goodwin Glenn
Bought by
Winters Catherine M and Goodwin Glenn
Current Estimated Value
Home Financials for this Owner
Home Financials are based on the most recent Mortgage that was taken out on this home.
Original Mortgage
$164,000
Outstanding Balance
$97,765
Interest Rate
3.9%
Mortgage Type
New Conventional
Estimated Equity
$334,897
Purchase Details
Closed on
Jul 20, 2010
Sold by
Young Shirley Joyce and Martha Jane Fipps Living Trust
Bought by
Winters Catherine M and Goodwin Glenn
Home Financials for this Owner
Home Financials are based on the most recent Mortgage that was taken out on this home.
Original Mortgage
$172,674
Interest Rate
4.75%
Mortgage Type
FHA
Purchase Details
Closed on
Mar 2, 2007
Sold by
Fipps Martha J
Bought by
Fipps Martha Jane and Martha Jane Fipps Living Trust
Create a Home Valuation Report for This Property
The Home Valuation Report is an in-depth analysis detailing your home's value as well as a comparison with similar homes in the area
Home Values in the Area
Average Home Value in this Area
Purchase History
| Date | Buyer | Sale Price | Title Company |
|---|---|---|---|
| Winters Catherine M | -- | First American | |
| Winters Catherine M | $175,000 | First American Title | |
| Fipps Martha Jane | -- | None Available |
Source: Public Records
Mortgage History
| Date | Status | Borrower | Loan Amount |
|---|---|---|---|
| Open | Winters Catherine M | $164,000 | |
| Closed | Winters Catherine M | $172,674 |
Source: Public Records
Tax History Compared to Growth
Tax History
| Year | Tax Paid | Tax Assessment Tax Assessment Total Assessment is a certain percentage of the fair market value that is determined by local assessors to be the total taxable value of land and additions on the property. | Land | Improvement |
|---|---|---|---|---|
| 2025 | $3,079 | $212,310 | $71,950 | $140,360 |
| 2024 | $3,079 | $206,130 | $69,850 | $136,280 |
| 2023 | $2,985 | $200,130 | $67,820 | $132,310 |
| 2022 | $2,912 | $200,130 | $67,820 | $132,310 |
| 2021 | $2,747 | $188,160 | $65,840 | $122,320 |
| 2020 | $2,689 | $182,680 | $63,920 | $118,760 |
| 2019 | $2,625 | $172,200 | $60,260 | $111,940 |
| 2018 | $2,244 | $146,650 | $58,510 | $88,140 |
| 2017 | $2,203 | $146,650 | $58,510 | $88,140 |
| 2016 | $2,218 | $138,240 | $55,160 | $83,080 |
| 2015 | $2,132 | $138,240 | $55,160 | $83,080 |
| 2014 | $1,966 | $122,320 | $51,990 | $70,330 |
Source: Public Records
Map
Nearby Homes
- 425 S Modoc Ave
- 1924 Crestbrook Rd
- 341 Ardmore Ave
- 2549 E Barnett Rd
- 305 S Groveland Ave
- 433 Highland Dr
- 430 Highland Dr
- 2458 Republic Way
- 2556 Dellwood Ave
- 2406 Senate Way
- 2462 Senate Way
- 101 S Modoc Ave
- 2233 Oakwood Dr
- 2566 Heritage Way
- 325 Sutter Ave
- 908 Black Oak Dr
- 9 S Groveland Ave
- 164 Black Oak Dr
- 2741 Ruth Dr
- 317 Eastwood Dr
- 694 S Modoc Ave
- 702 S Modoc Ave
- 712 S Modoc Ave
- 562 Windsor Ave
- 690 S Modoc Ave
- 548 Windsor Ave
- 2174 Duncan Dr
- 2162 Duncan Dr
- 716 S Modoc Ave
- 693 S Modoc Ave
- 2180 Duncan Dr
- 689 S Modoc Ave
- 701 S Modoc Ave
- 2185 Crestbrook Rd
- 2191 Crestbrook Rd
- 720 S Modoc 722 Ave
- 2175 Crestbrook Rd
- 711 S Modoc Ave
- 2156 Duncan Dr