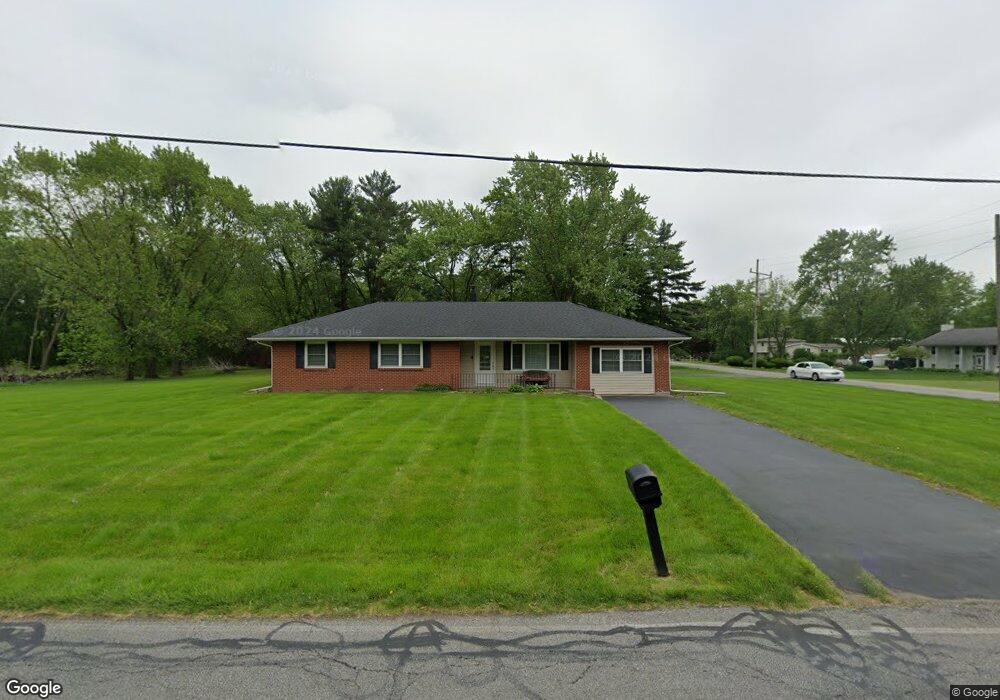
698 W 700 N Hobart, IN 46342
Estimated Value: $257,843 - $279,000
3
Beds
2
Baths
1,550
Sq Ft
$175/Sq Ft
Est. Value
About This Home
This home is located at 698 W 700 N, Hobart, IN 46342 and is currently estimated at $270,711, approximately $174 per square foot. 698 W 700 N is a home located in Porter County with nearby schools including South Haven Elementary School, William Fegely Middle School, and Portage High School.
Ownership History
Date
Name
Owned For
Owner Type
Purchase Details
Closed on
Feb 28, 2019
Sold by
Marcyanik Stanley T and Bane Deborah L
Bought by
Marcyanik Stanley T and Bane Deborah L
Current Estimated Value
Purchase Details
Closed on
Mar 5, 2007
Sold by
Rau Michelle
Bought by
Marcyanik Stanley T and Bane Deborah L
Home Financials for this Owner
Home Financials are based on the most recent Mortgage that was taken out on this home.
Original Mortgage
$133,119
Outstanding Balance
$80,663
Interest Rate
6.28%
Mortgage Type
FHA
Estimated Equity
$190,048
Purchase Details
Closed on
Nov 27, 2006
Sold by
Rau Robert
Bought by
Rau Michelle
Purchase Details
Closed on
Jul 15, 2005
Sold by
Hud
Bought by
Rau Robert
Purchase Details
Closed on
Dec 15, 2004
Sold by
Midfirst Bank
Bought by
Hud
Create a Home Valuation Report for This Property
The Home Valuation Report is an in-depth analysis detailing your home's value as well as a comparison with similar homes in the area
Home Values in the Area
Average Home Value in this Area
Purchase History
| Date | Buyer | Sale Price | Title Company |
|---|---|---|---|
| Marcyanik Stanley T | -- | None Available | |
| Marcyanik Stanley T | -- | Ticor Title Insurance | |
| Rau Michelle | -- | None Available | |
| Rau Robert | -- | Contract Processing & Title | |
| Hud | -- | -- | |
| Mortgage Electronic Registration Systems | $129,618 | -- |
Source: Public Records
Mortgage History
| Date | Status | Borrower | Loan Amount |
|---|---|---|---|
| Open | Marcyanik Stanley T | $133,119 |
Source: Public Records
Tax History Compared to Growth
Tax History
| Year | Tax Paid | Tax Assessment Tax Assessment Total Assessment is a certain percentage of the fair market value that is determined by local assessors to be the total taxable value of land and additions on the property. | Land | Improvement |
|---|---|---|---|---|
| 2024 | $1,347 | $180,000 | $27,300 | $152,700 |
| 2023 | $1,207 | $174,300 | $26,000 | $148,300 |
| 2022 | $1,235 | $166,500 | $26,000 | $140,500 |
| 2021 | $1,156 | $142,300 | $26,000 | $116,300 |
| 2020 | $1,082 | $134,200 | $23,500 | $110,700 |
| 2019 | $1,005 | $124,700 | $23,500 | $101,200 |
| 2018 | $1,079 | $129,000 | $23,500 | $105,500 |
| 2017 | $837 | $118,300 | $23,500 | $94,800 |
| 2016 | $849 | $113,900 | $23,100 | $90,800 |
| 2014 | $684 | $103,100 | $23,100 | $80,000 |
| 2013 | -- | $105,000 | $25,100 | $79,900 |
Source: Public Records
Map
Nearby Homes
- 679 N 700 W
- BELLAMY Plan at Bauer Farm
- HENLEY Plan at Bauer Farm
- HARMONY Plan at Bauer Farm
- 4160 Viceroy St
- 4156 Viceroy St
- 4064 Viceroy St
- 4149 Viceroy St
- 4153 Viceroy St
- 4150 Viceroy St
- 4121 Viceroy St
- 4118 Viceroy St
- 4146 Viceroy St
- 4164 Viceroy St
- 5699 Brookview Ave
- 4163 Viceroy St
- 4175 Viceroy St
- 5735 Brookview Ave
- 5719 Kingman Ave
- 3716 Walsh St