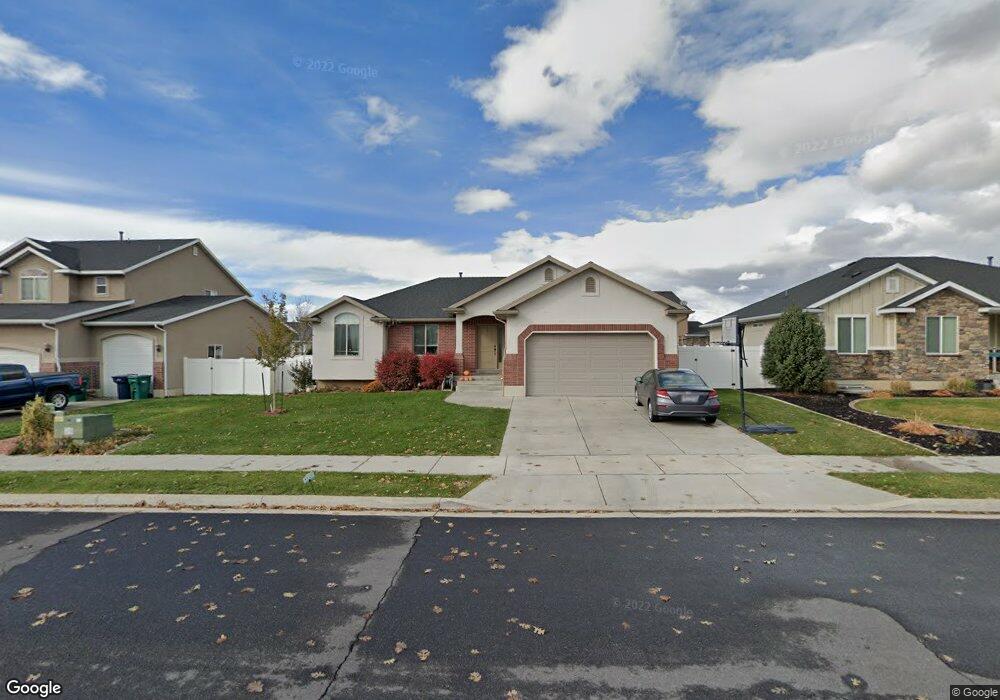
698 Weaver Ln Layton, UT 84041
Estimated Value: $639,000 - $659,000
5
Beds
4
Baths
1,579
Sq Ft
$411/Sq Ft
Est. Value
About This Home
This home is located at 698 Weaver Ln, Layton, UT 84041 and is currently estimated at $648,258, approximately $410 per square foot. 698 Weaver Ln is a home with nearby schools including Heritage Elementary School, Shoreline Junior High School, and Layton High School.
Ownership History
Date
Name
Owned For
Owner Type
Purchase Details
Closed on
Feb 23, 2026
Sold by
John Albretsen and Denan Albretsen Brooke
Bought by
Jacob And Brooke Albretsen Living Trust and Albretsen
Current Estimated Value
Purchase Details
Closed on
Feb 4, 2022
Sold by
Alberesten Jacob J
Bought by
Albretsen Jacob and Albretsen Brooke
Home Financials for this Owner
Home Financials are based on the most recent Mortgage that was taken out on this home.
Original Mortgage
$278,000
Interest Rate
3.55%
Mortgage Type
New Conventional
Purchase Details
Closed on
Aug 1, 2013
Sold by
Ed Green Construction Inc
Bought by
Albretsen Jacob J and Albretsen Brooke D
Home Financials for this Owner
Home Financials are based on the most recent Mortgage that was taken out on this home.
Original Mortgage
$246,431
Interest Rate
3.92%
Mortgage Type
New Conventional
Purchase Details
Closed on
Aug 13, 2012
Sold by
Nsc West Properties Llc
Bought by
Ed Green Construction Inc
Purchase Details
Closed on
Jul 18, 2012
Sold by
Ncs West Properties Llc
Bought by
Ed Green Construction Inc
Create a Home Valuation Report for This Property
The Home Valuation Report is an in-depth analysis detailing your home's value as well as a comparison with similar homes in the area
Home Values in the Area
Average Home Value in this Area
Purchase History
We collect this data history from publicly available records. To have your information removed, we recommend requesting removal directly through your county’s website.
| Date | Buyer | Sale Price | Title Company |
|---|---|---|---|
| Jacob And Brooke Albretsen Living Trust | -- | None Listed On Document | |
| Albretsen Jacob | -- | New Title Company Name | |
| Albretsen Jacob J | -- | Security Title Of Davis Coun | |
| Ed Green Construction Inc | -- | Mountain View Title & | |
| Ed Green Construction Inc | -- | Mountain View Title & |
Source: Public Records
Mortgage History
We collect this data history from publicly available records. To have your information removed, we recommend requesting removal directly through your county’s website.
| Date | Status | Borrower | Loan Amount |
|---|---|---|---|
| Previous Owner | Albretsen Jacob | $278,000 | |
| Previous Owner | Albretsen Jacob J | $246,431 |
Source: Public Records
Tax History
| Year | Tax Paid | Tax Assessment Tax Assessment Total Assessment is a certain percentage of the fair market value that is determined by local assessors to be the total taxable value of land and additions on the property. | Land | Improvement |
|---|---|---|---|---|
| 2025 | $3,050 | $320,100 | $110,802 | $209,298 |
| 2024 | $2,939 | $310,750 | $122,590 | $188,160 |
| 2023 | $2,838 | $529,000 | $121,259 | $407,741 |
| 2022 | $2,896 | $293,150 | $75,863 | $217,287 |
| 2021 | $2,743 | $414,000 | $113,820 | $300,180 |
| 2020 | $2,472 | $358,000 | $95,725 | $262,275 |
| 2019 | $2,425 | $344,000 | $98,440 | $245,560 |
| 2018 | $2,205 | $314,000 | $86,314 | $227,686 |
| 2016 | $2,135 | $156,860 | $33,796 | $123,064 |
| 2015 | $2,008 | $140,030 | $33,796 | $106,234 |
| 2014 | $2,250 | $160,403 | $33,796 | $126,607 |
| 2013 | -- | $76,592 | $76,592 | $0 |
Source: Public Records
Map
Nearby Homes
- 757 S 725 W
- 1026 W 450 S
- 486 W 350 S
- 698 Farmland Dr
- 979 Shoreline Dr
- 1339 W 575 S
- 1113 W Angel Hill Ct
- 1924 W Pearl Park Cir
- 307 Park St
- 2052 W Phillips St
- 1369 W 725 S
- 750 W Gentile St
- 418 W Gentile St
- 409 N Hill Farms Ln
- 423 N Joseph Acres Rd
- 157 N 750 W
- 97 Dawson St
- 180 E 900 S
- 326 Apricot Grove
- 1468 Flint Meadow Dr
Your Personal Tour Guide
Ask me questions while you tour the home.