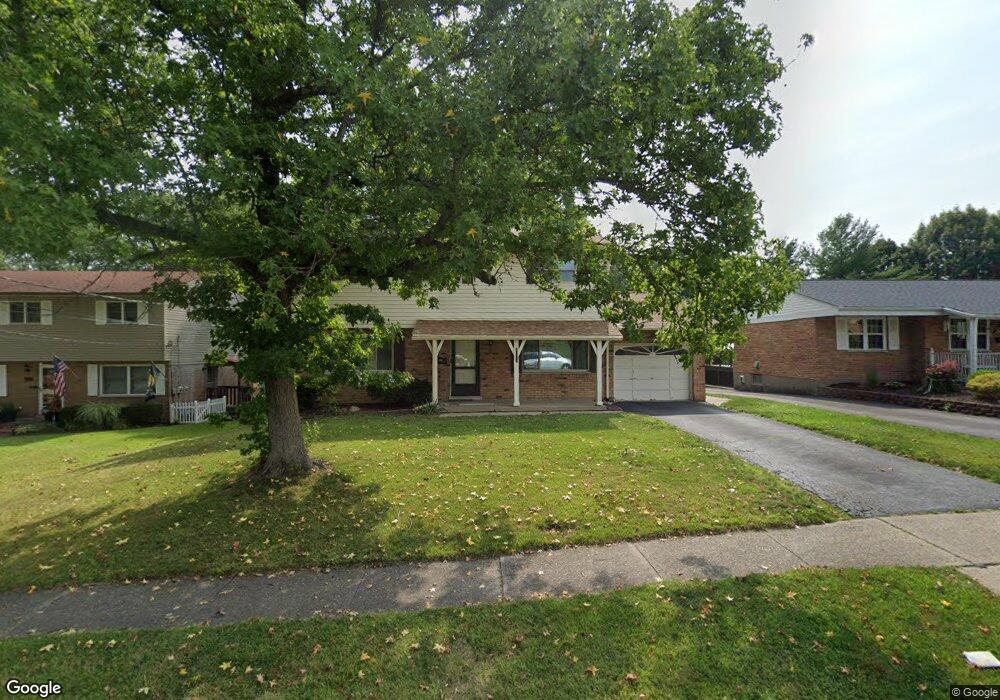
6982 Allet Ave Cincinnati, OH 45239
Estimated Value: $272,000 - $312,000
4
Beds
3
Baths
2,128
Sq Ft
$135/Sq Ft
Est. Value
About This Home
This home is located at 6982 Allet Ave, Cincinnati, OH 45239 and is currently estimated at $286,995, approximately $134 per square foot. 6982 Allet Ave is a home located in Hamilton County with nearby schools including White Oak Middle School, Colerain High School, and Cincinnati Achievement Academy.
Ownership History
Date
Name
Owned For
Owner Type
Purchase Details
Closed on
Aug 10, 2009
Sold by
Dadosky Jerome T and Dadosky Lora R
Bought by
Tohe Tesfaye and Gelete Nigist
Current Estimated Value
Home Financials for this Owner
Home Financials are based on the most recent Mortgage that was taken out on this home.
Original Mortgage
$120,000
Outstanding Balance
$78,559
Interest Rate
5.29%
Mortgage Type
Unknown
Estimated Equity
$208,436
Purchase Details
Closed on
Mar 17, 1998
Sold by
Hulley Jimmy E and Hulley Patricia A
Bought by
Dadosky Jerome T and Dadosky Lora R
Home Financials for this Owner
Home Financials are based on the most recent Mortgage that was taken out on this home.
Original Mortgage
$94,800
Interest Rate
7.19%
Purchase Details
Closed on
Aug 3, 1994
Sold by
Hulley Jimmy E and Hulley Patricia A
Bought by
Hulley Jimmy E and Hulley Patricia A
Create a Home Valuation Report for This Property
The Home Valuation Report is an in-depth analysis detailing your home's value as well as a comparison with similar homes in the area
Home Values in the Area
Average Home Value in this Area
Purchase History
| Date | Buyer | Sale Price | Title Company |
|---|---|---|---|
| Tohe Tesfaye | -- | Stewart Title Company | |
| Dadosky Jerome T | $118,500 | Ati Title Agency Of Ohio Inc | |
| Hulley Jimmy E | -- | -- |
Source: Public Records
Mortgage History
| Date | Status | Borrower | Loan Amount |
|---|---|---|---|
| Open | Tohe Tesfaye | $120,000 | |
| Previous Owner | Dadosky Jerome T | $94,800 |
Source: Public Records
Tax History Compared to Growth
Tax History
| Year | Tax Paid | Tax Assessment Tax Assessment Total Assessment is a certain percentage of the fair market value that is determined by local assessors to be the total taxable value of land and additions on the property. | Land | Improvement |
|---|---|---|---|---|
| 2024 | $4,240 | $79,370 | $12,128 | $67,242 |
| 2023 | $4,266 | $79,370 | $12,128 | $67,242 |
| 2022 | $3,525 | $53,466 | $10,710 | $42,756 |
| 2021 | $3,495 | $53,466 | $10,710 | $42,756 |
| 2020 | $3,531 | $53,466 | $10,710 | $42,756 |
| 2019 | $3,052 | $43,120 | $8,638 | $34,482 |
| 2018 | $2,738 | $43,120 | $8,638 | $34,482 |
| 2017 | $2,594 | $43,120 | $8,638 | $34,482 |
| 2016 | $2,242 | $36,751 | $9,083 | $27,668 |
| 2015 | $2,264 | $36,751 | $9,083 | $27,668 |
| 2014 | $2,268 | $36,751 | $9,083 | $27,668 |
| 2013 | $2,159 | $36,751 | $9,083 | $27,668 |
Source: Public Records
Map
Nearby Homes
- 3219 Banning Rd
- 3250 March Terrace
- 3171 Preserve Ln
- 3307 Lapland Dr
- 3335 Lapland Dr
- 7476 Boleyn Dr
- 3041 Preserve Ln
- 3329 Alexis Rd
- 3442 Lapland Dr
- 3387 Lapland Dr
- 3279 Rockacres Ct
- 6267 Seiler Dr
- 7448 Locust View Ln
- 7776 Cella Dr
- 3225 Crimson Ln
- 6195 Seiler Dr
- 3397 Nandale Dr
- 2811 Breezy Way
- 3611 Benhill Dr
- 7640 Cheviot Rd
- 7004 Allet Ave
- 6960 Allet Ave
- 6938 Allet Ave
- 3235 Banning Rd
- 7026 Allet Ave
- 6916 Allet Ave
- 6983 Allet Ave
- 7048 Allet Ave
- 3233 Banning Rd
- 7005 Allet Ave
- 6961 Allet Ave
- 6939 Allet Ave
- 6894 Allet Ave
- 7049 Allet Ave
- 7027 Allet Ave
- 6823 Marchwind Ct
- 3225 Banning Rd
- 6872 Allet Ave
- 3253 Banning Rd
- 3245 Banning Rd