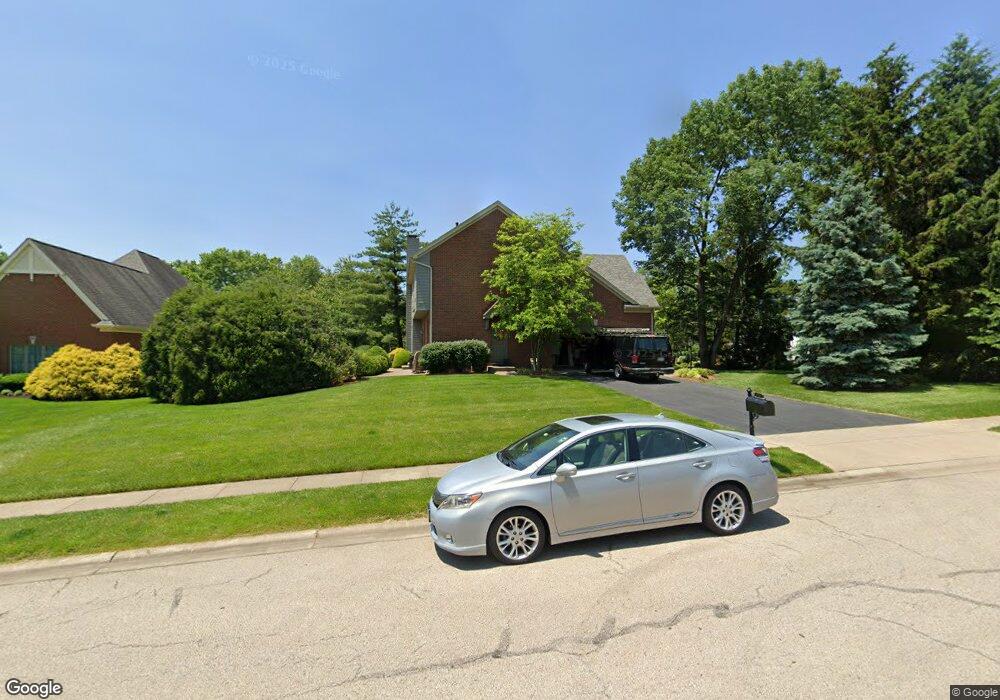
6985 Charlesfield Ln Cincinnati, OH 45243
Estimated Value: $931,067 - $1,147,000
5
Beds
5
Baths
4,144
Sq Ft
$251/Sq Ft
Est. Value
About This Home
This home is located at 6985 Charlesfield Ln, Cincinnati, OH 45243 and is currently estimated at $1,040,022, approximately $250 per square foot. 6985 Charlesfield Ln is a home located in Hamilton County with nearby schools including Madeira Elementary School, Madeira Middle School, and Madeira High School.
Ownership History
Date
Name
Owned For
Owner Type
Purchase Details
Closed on
Aug 22, 2008
Sold by
Wallace William E and Wallace Ruth N
Bought by
Polanco Tara
Current Estimated Value
Home Financials for this Owner
Home Financials are based on the most recent Mortgage that was taken out on this home.
Original Mortgage
$417,000
Outstanding Balance
$268,799
Interest Rate
6.31%
Mortgage Type
New Conventional
Estimated Equity
$771,223
Purchase Details
Closed on
Jul 31, 2003
Sold by
Camden Homes Inc
Bought by
Wallace William E and Wallace Ruth N
Purchase Details
Closed on
Jul 23, 2003
Sold by
Fox Hunt Land Co Llc
Bought by
Camden Homes Inc
Create a Home Valuation Report for This Property
The Home Valuation Report is an in-depth analysis detailing your home's value as well as a comparison with similar homes in the area
Home Values in the Area
Average Home Value in this Area
Purchase History
| Date | Buyer | Sale Price | Title Company |
|---|---|---|---|
| Polanco Tara | $630,000 | Attorney | |
| Wallace William E | $649,900 | -- | |
| Camden Homes Inc | $145,000 | -- |
Source: Public Records
Mortgage History
| Date | Status | Borrower | Loan Amount |
|---|---|---|---|
| Open | Polanco Tara | $417,000 |
Source: Public Records
Tax History
| Year | Tax Paid | Tax Assessment Tax Assessment Total Assessment is a certain percentage of the fair market value that is determined by local assessors to be the total taxable value of land and additions on the property. | Land | Improvement |
|---|---|---|---|---|
| 2025 | $15,226 | $259,053 | $64,750 | $194,303 |
| 2024 | $14,831 | $259,053 | $64,750 | $194,303 |
| 2023 | $15,029 | $259,053 | $64,750 | $194,303 |
| 2022 | $19,213 | $270,764 | $72,520 | $198,244 |
| 2021 | $18,803 | $270,764 | $72,520 | $198,244 |
| 2020 | $17,394 | $270,764 | $72,520 | $198,244 |
| 2019 | $16,252 | $233,429 | $64,750 | $168,679 |
| 2018 | $16,382 | $227,591 | $64,750 | $162,841 |
| 2017 | $15,145 | $227,591 | $64,750 | $162,841 |
| 2016 | $13,494 | $191,223 | $64,400 | $126,823 |
| 2015 | $12,482 | $191,223 | $64,400 | $126,823 |
| 2014 | $12,554 | $191,223 | $64,400 | $126,823 |
| 2013 | $14,160 | $207,851 | $70,000 | $137,851 |
Source: Public Records
Map
Nearby Homes
- 6752 Rose Crest Ave
- 7752 Montgomery Rd
- 7151 Euclid Ave
- 7159 Hosbrook Rd
- 7321 Hosbrook Rd
- 7220 Mar Del Dr
- 7406 Dawson Rd
- 7133 Fowler Ave
- 7317 Euclid Ave
- 7474 Dawson Rd
- 7156 Maple Ave
- 7503 S Timberlane Dr
- 7300 N Mingo Ln
- 4390 Yakima Ct
- 7437 Madeira Pines Dr
- 4673 Happiness Way
- 4300 Hegner Ave
- 4248 South Ave
- 4224 North Ave
- 4267 Clifford Rd
- 6511 Euclid Ave
- 6975 Charlesfield Ln
- 6531 Euclid Ave
- 6591 Euclid Ave
- 6505 Euclid Ave
- 6967 Charlesfield Ln
- 6990 Charlesfield Ln
- 6980 Charlesfield Ln
- 6460 Euclid Ave
- 6470 Euclid Ave
- 6970 Charlesfield Ln
- 6491 Euclid Ave
- 6480 Euclid Ave
- 6957 Charlesfield Ln
- 6958 Charlesfield Ln
- 6621 Euclid Ave
- 6440 Euclid Ave
- 6510 Michael Dr
- 6475 Euclid Ave
- 6522 Euclid Ave
Your Personal Tour Guide
Ask me questions while you tour the home.