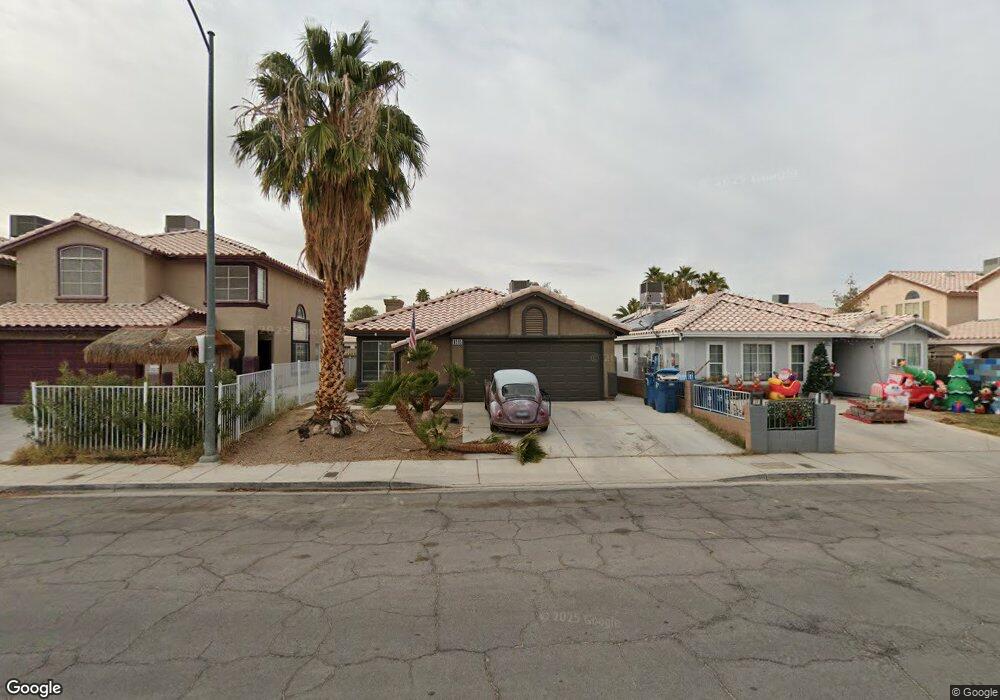
6985 Luminary Dr Las Vegas, NV 89119
Paradise Valley NeighborhoodEstimated Value: $376,000 - $421,000
3
Beds
2
Baths
1,312
Sq Ft
$299/Sq Ft
Est. Value
About This Home
This home is located at 6985 Luminary Dr, Las Vegas, NV 89119 and is currently estimated at $392,598, approximately $299 per square foot. 6985 Luminary Dr is a home located in Clark County with nearby schools including Doris French Elementary School, Jack Lund Schofield Middle School, and Silverado High School.
Ownership History
Date
Name
Owned For
Owner Type
Purchase Details
Closed on
May 22, 2003
Sold by
Baro Jose E and Baro Darlene R
Bought by
Lyman Alan and Lyman Brittany
Current Estimated Value
Home Financials for this Owner
Home Financials are based on the most recent Mortgage that was taken out on this home.
Original Mortgage
$128,000
Outstanding Balance
$58,496
Interest Rate
6.5%
Mortgage Type
Unknown
Estimated Equity
$334,102
Purchase Details
Closed on
Nov 12, 1997
Sold by
Wohlers Allen C
Bought by
Baro Jose E and Baro Darlene R
Home Financials for this Owner
Home Financials are based on the most recent Mortgage that was taken out on this home.
Original Mortgage
$115,593
Interest Rate
7.3%
Mortgage Type
FHA
Purchase Details
Closed on
Jan 17, 1995
Sold by
Wohlers Allen C
Bought by
Wohlers Allen C and The Allen C Wohlers Living Trust
Purchase Details
Closed on
Aug 10, 1994
Sold by
Lewis Homes Of Nevada
Bought by
Wohlers Allen C
Home Financials for this Owner
Home Financials are based on the most recent Mortgage that was taken out on this home.
Original Mortgage
$76,900
Interest Rate
8.78%
Create a Home Valuation Report for This Property
The Home Valuation Report is an in-depth analysis detailing your home's value as well as a comparison with similar homes in the area
Home Values in the Area
Average Home Value in this Area
Purchase History
| Date | Buyer | Sale Price | Title Company |
|---|---|---|---|
| Lyman Alan | $160,000 | United Title Of Nevada | |
| Baro Jose E | $117,000 | Land Title | |
| Wohlers Allen C | -- | -- | |
| Wohlers Allen C | $110,000 | Land Title |
Source: Public Records
Mortgage History
| Date | Status | Borrower | Loan Amount |
|---|---|---|---|
| Open | Lyman Alan | $128,000 | |
| Previous Owner | Baro Jose E | $115,593 | |
| Previous Owner | Wohlers Allen C | $76,900 | |
| Closed | Lyman Alan | $32,000 |
Source: Public Records
Tax History Compared to Growth
Tax History
| Year | Tax Paid | Tax Assessment Tax Assessment Total Assessment is a certain percentage of the fair market value that is determined by local assessors to be the total taxable value of land and additions on the property. | Land | Improvement |
|---|---|---|---|---|
| 2025 | $1,338 | $82,887 | $32,900 | $49,987 |
| 2024 | $1,366 | $82,887 | $32,900 | $49,987 |
| 2023 | $1,366 | $78,340 | $30,800 | $47,540 |
| 2022 | $1,377 | $68,448 | $24,780 | $43,668 |
| 2021 | $1,275 | $64,681 | $23,100 | $41,581 |
| 2020 | $1,181 | $64,405 | $23,100 | $41,305 |
| 2019 | $1,107 | $60,846 | $19,950 | $40,896 |
| 2018 | $1,056 | $55,644 | $16,100 | $39,544 |
| 2017 | $1,599 | $54,520 | $14,350 | $40,170 |
| 2016 | $990 | $49,770 | $9,450 | $40,320 |
| 2015 | $987 | $43,456 | $8,750 | $34,706 |
| 2014 | $958 | $31,692 | $7,000 | $24,692 |
Source: Public Records
Map
Nearby Homes
- 2130 E Maule Ave
- 2034 Glistening Sands Dr
- 7090 Knoll View Dr
- 6960 Wine River Dr
- 7164 Paradise Bay Dr
- 7146 Magic Moment Ln
- 7218 Nordic Lights Dr
- 7188 Magic Moment Ln
- 1553 Bright View Dr
- 7171 Cypress Gardens Ln
- 2035 E Warm Springs Rd Unit 1019
- 2035 E Warm Springs Rd Unit 1001
- 1508 White Dr
- 1640 Crystal Shadows Cir
- 1653 Crystal Shadows Cir
- 7098 Rusty Nail Way
- 1740 Olympia Dr
- 1461 Lawman Ct
- 6859 Tamarus St Unit 101
- 7167 La Puebla St
- 6991 Luminary Dr
- 6977 Luminary Dr
- 2092 Sierra Stone Ln
- 7001 Luminary Dr
- 2127 Blue Zenith Cir
- 2119 Blue Zenith Cir
- 2080 Sierra Stone Ln
- 2111 Blue Zenith Cir
- 2103 Blue Zenith Cir
- 6984 Luminary Dr
- 6976 Luminary Dr
- 6990 Luminary Dr
- 2072 Sierra Stone Ln
- 6970 Luminary Dr
- 6998 Luminary Dr
- 6964 Luminary Dr
- 6964 Luminary Dr Unit none
- 7004 Luminary Dr
- 2087 Blue Zenith Cir
- 2103 Sierra Stone Ln