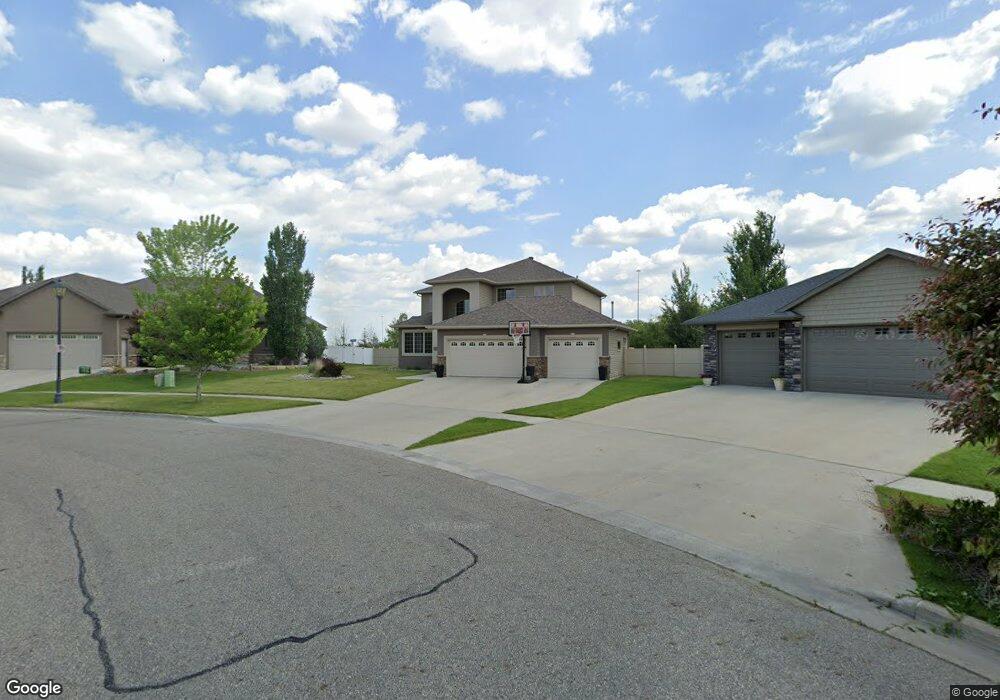
699 20 1 2 Ave E West Fargo, ND 58078
Charleswood NeighborhoodEstimated Value: $637,000 - $697,000
5
Beds
3
Baths
3,677
Sq Ft
$181/Sq Ft
Est. Value
About This Home
This home is located at 699 20 1 2 Ave E, West Fargo, ND 58078 and is currently estimated at $663,882, approximately $180 per square foot. 699 20 1 2 Ave E is a home located in Cass County with nearby schools including South Elementary School, Cheney Middle School, and West Fargo High School.
Ownership History
Date
Name
Owned For
Owner Type
Purchase Details
Closed on
May 14, 2021
Sold by
Honeyman Leilyn A and Honeyman Linda K
Bought by
Stasch Dustin J and Stasch Shaina
Current Estimated Value
Home Financials for this Owner
Home Financials are based on the most recent Mortgage that was taken out on this home.
Original Mortgage
$452,500
Outstanding Balance
$410,078
Interest Rate
3.1%
Mortgage Type
New Conventional
Estimated Equity
$253,804
Purchase Details
Closed on
Jul 17, 2009
Sold by
Hertage Homes Llc
Bought by
Honeyman Leilyn A and Honeyman Linda K
Home Financials for this Owner
Home Financials are based on the most recent Mortgage that was taken out on this home.
Original Mortgage
$317,600
Interest Rate
5.32%
Mortgage Type
Purchase Money Mortgage
Purchase Details
Closed on
Feb 16, 2009
Sold by
Charleswood Inc
Bought by
Heritage Homes Llc
Home Financials for this Owner
Home Financials are based on the most recent Mortgage that was taken out on this home.
Original Mortgage
$240,369
Interest Rate
5.05%
Mortgage Type
Credit Line Revolving
Purchase Details
Closed on
Jul 11, 2006
Sold by
Klein Construction Inc
Bought by
Whaley Thomas C and Whaley Jane M
Create a Home Valuation Report for This Property
The Home Valuation Report is an in-depth analysis detailing your home's value as well as a comparison with similar homes in the area
Home Values in the Area
Average Home Value in this Area
Purchase History
| Date | Buyer | Sale Price | Title Company |
|---|---|---|---|
| Stasch Dustin J | $512,500 | Plains Title Llc | |
| Honeyman Leilyn A | -- | -- | |
| Heritage Homes Llc | -- | -- | |
| Whaley Thomas C | -- | -- |
Source: Public Records
Mortgage History
| Date | Status | Borrower | Loan Amount |
|---|---|---|---|
| Open | Stasch Dustin J | $452,500 | |
| Previous Owner | Honeyman Leilyn A | $317,600 | |
| Previous Owner | Heritage Homes Llc | $240,369 |
Source: Public Records
Tax History Compared to Growth
Tax History
| Year | Tax Paid | Tax Assessment Tax Assessment Total Assessment is a certain percentage of the fair market value that is determined by local assessors to be the total taxable value of land and additions on the property. | Land | Improvement |
|---|---|---|---|---|
| 2024 | $7,457 | $284,850 | $63,950 | $220,900 |
| 2023 | $7,602 | $269,700 | $63,950 | $205,750 |
| 2022 | $7,801 | $265,200 | $63,950 | $201,250 |
| 2021 | $7,236 | $235,750 | $53,300 | $182,450 |
| 2020 | $6,843 | $228,850 | $53,300 | $175,550 |
| 2019 | $6,852 | $236,150 | $53,300 | $182,850 |
| 2018 | $6,457 | $232,350 | $53,300 | $179,050 |
| 2017 | $7,163 | $234,250 | $53,300 | $180,950 |
| 2016 | $6,523 | $229,250 | $53,300 | $175,950 |
| 2015 | $5,962 | $186,800 | $26,650 | $160,150 |
| 2014 | $5,715 | $174,600 | $26,650 | $147,950 |
| 2013 | $5,828 | $174,600 | $26,650 | $147,950 |
Source: Public Records
Map
Nearby Homes
- 699 20 1/2 Ave E
- 695 20 1/2 Ave E
- 2051 7th St E
- 691 20 1/2 Ave E
- 2044 7th St E
- 691 20 1 2 Ave E
- 2043 7th St E
- 687 20 1/2 Ave E
- 2036 7th St E
- 2035 7th St E
- 2041 Kenaston Ct
- 2033 Kenaston Ct
- 683 20 1 2 Ave E
- 2028 7th St E
- 683 20 1/2 Ave E
- 2025 Kenaston Ct
- 737 Augusta Place
- 679 20 5 Ave E
- 679 20 1/2 Ave E
- 729 Augusta Place