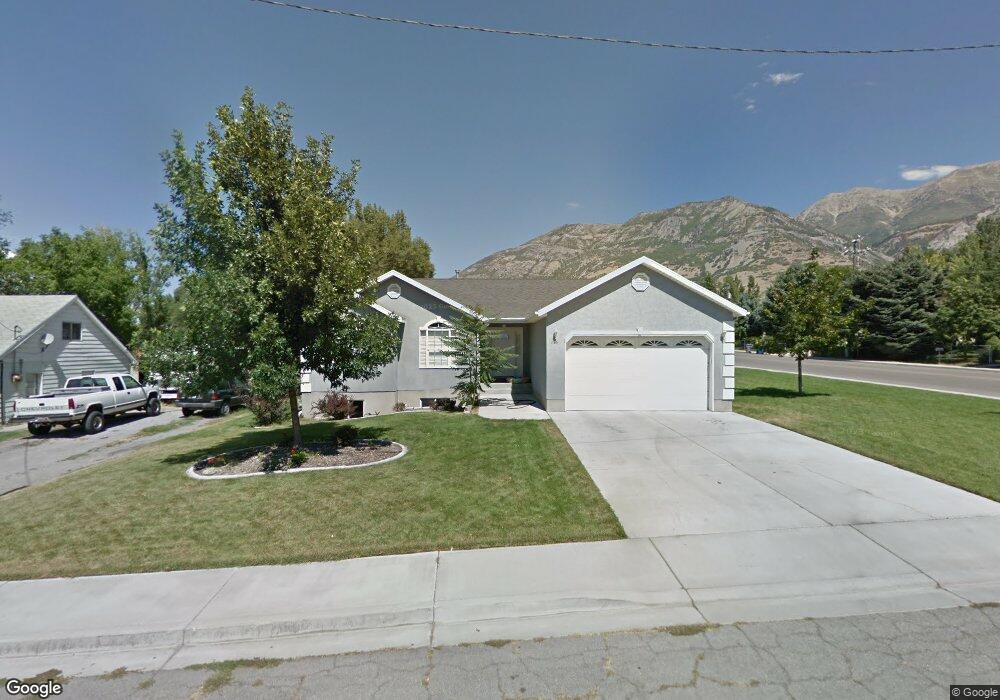
699 E 100 S Pleasant Grove, UT 84062
Estimated Value: $590,000 - $650,797
3
Beds
2
Baths
3,300
Sq Ft
$191/Sq Ft
Est. Value
About This Home
This home is located at 699 E 100 S, Pleasant Grove, UT 84062 and is currently estimated at $630,449, approximately $191 per square foot. 699 E 100 S is a home located in Utah County with nearby schools including Grovecrest Elementary School, Pleasant Grove Junior High School, and Pleasant Grove High School.
Ownership History
Date
Name
Owned For
Owner Type
Purchase Details
Closed on
Apr 3, 2020
Sold by
Hanseen Dylan J
Bought by
Hanseen Dylan and Hanseen Ashley
Current Estimated Value
Home Financials for this Owner
Home Financials are based on the most recent Mortgage that was taken out on this home.
Original Mortgage
$320,000
Outstanding Balance
$283,481
Interest Rate
3.4%
Mortgage Type
New Conventional
Estimated Equity
$346,968
Purchase Details
Closed on
Sep 16, 2011
Sold by
Carlson Jason K
Bought by
Hanseen Dylan J
Home Financials for this Owner
Home Financials are based on the most recent Mortgage that was taken out on this home.
Original Mortgage
$158,519
Interest Rate
3.75%
Mortgage Type
FHA
Purchase Details
Closed on
Feb 4, 2002
Sold by
Carlson Jason K and Carlson Kimberly S
Bought by
Carlson Jason K
Home Financials for this Owner
Home Financials are based on the most recent Mortgage that was taken out on this home.
Original Mortgage
$138,000
Interest Rate
7.15%
Create a Home Valuation Report for This Property
The Home Valuation Report is an in-depth analysis detailing your home's value as well as a comparison with similar homes in the area
Home Values in the Area
Average Home Value in this Area
Purchase History
| Date | Buyer | Sale Price | Title Company |
|---|---|---|---|
| Hanseen Dylan | -- | Utah First Title Ins Agcy | |
| Hanseen Dylan J | -- | Inwest Title Services Inc | |
| Carlson Jason K | -- | Metro National Title |
Source: Public Records
Mortgage History
| Date | Status | Borrower | Loan Amount |
|---|---|---|---|
| Open | Hanseen Dylan | $320,000 | |
| Closed | Hanseen Dylan J | $158,519 | |
| Previous Owner | Carlson Jason K | $138,000 |
Source: Public Records
Tax History Compared to Growth
Tax History
| Year | Tax Paid | Tax Assessment Tax Assessment Total Assessment is a certain percentage of the fair market value that is determined by local assessors to be the total taxable value of land and additions on the property. | Land | Improvement |
|---|---|---|---|---|
| 2025 | $2,526 | $322,685 | $214,200 | $372,500 |
| 2024 | $2,526 | $301,510 | $0 | $0 |
| 2023 | $2,495 | $304,865 | $0 | $0 |
| 2022 | $2,689 | $326,920 | $0 | $0 |
| 2021 | $2,144 | $396,800 | $153,700 | $243,100 |
| 2020 | $1,803 | $327,200 | $137,200 | $190,000 |
| 2019 | $1,659 | $311,400 | $126,100 | $185,300 |
| 2018 | $1,650 | $292,800 | $115,000 | $177,800 |
| 2017 | $1,461 | $138,050 | $0 | $0 |
| 2016 | $1,411 | $128,700 | $0 | $0 |
| 2015 | $1,448 | $125,015 | $0 | $0 |
| 2014 | $1,386 | $118,580 | $0 | $0 |
Source: Public Records
Map
Nearby Homes