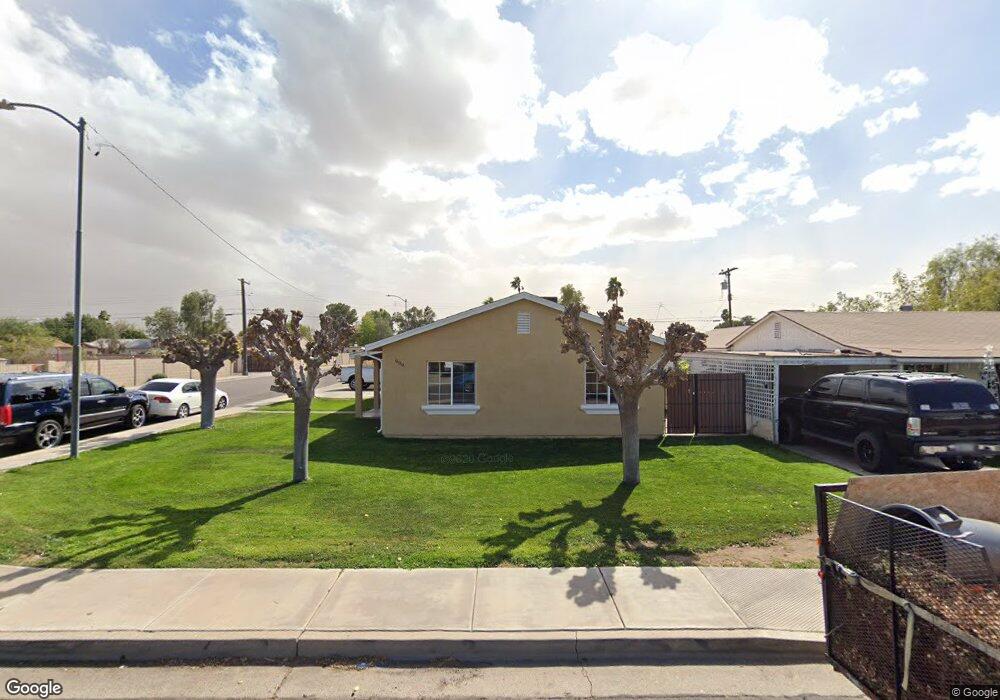
699 E Flint St Chandler, AZ 85225
Downtown Chandler NeighborhoodEstimated Value: $273,000 - $349,000
Studio
1
Bath
1,248
Sq Ft
$256/Sq Ft
Est. Value
About This Home
This home is located at 699 E Flint St, Chandler, AZ 85225 and is currently estimated at $319,165, approximately $255 per square foot. 699 E Flint St is a home located in Maricopa County with nearby schools including Galveston Elementary School, Chandler High School, and Willis Junior High School.
Ownership History
Date
Name
Owned For
Owner Type
Purchase Details
Closed on
Jul 26, 2021
Sold by
Sauceda Guillermo Olivas and Olivas Guillermo
Bought by
Guillermo S Olivas Trust and Sauceda
Current Estimated Value
Purchase Details
Closed on
Jul 23, 2021
Sold by
Olivas Guillermo and Sauceda Guillermo Olivas
Bought by
Sauceda Guillermo Olivas and Guillermo S Olivas Trust
Purchase Details
Closed on
Jul 21, 2021
Sold by
Sanchez Concepcion
Bought by
Olivas Guillermo
Purchase Details
Closed on
Apr 25, 2000
Sold by
Tenney Sylvia C
Bought by
Olivas Guillermo and Sanchez Concepcion
Home Financials for this Owner
Home Financials are based on the most recent Mortgage that was taken out on this home.
Original Mortgage
$87,203
Interest Rate
8.24%
Mortgage Type
New Conventional
Purchase Details
Closed on
Jun 11, 1997
Sold by
Tenney Sylvia C
Bought by
Tenney Sylvia C and The Sylvia C Tenney Trust
Create a Home Valuation Report for This Property
The Home Valuation Report is an in-depth analysis detailing your home's value as well as a comparison with similar homes in the area
Home Values in the Area
Average Home Value in this Area
Purchase History
| Date | Buyer | Sale Price | Title Company |
|---|---|---|---|
| Guillermo S Olivas Trust | -- | None Listed On Document | |
| Olivas Guillermo | -- | None Listed On Document | |
| Sauceda Guillermo Olivas | -- | None Available | |
| Olivas Guillermo | -- | None Available | |
| Olivas Guillermo | $89,900 | Arizona Title Agency Inc | |
| Tenney Sylvia C | -- | -- |
Source: Public Records
Mortgage History
| Date | Status | Borrower | Loan Amount |
|---|---|---|---|
| Previous Owner | Olivas Guillermo | $87,203 |
Source: Public Records
Tax History
| Year | Tax Paid | Tax Assessment Tax Assessment Total Assessment is a certain percentage of the fair market value that is determined by local assessors to be the total taxable value of land and additions on the property. | Land | Improvement |
|---|---|---|---|---|
| 2025 | $619 | $7,953 | -- | -- |
| 2024 | $598 | $7,574 | -- | -- |
| 2023 | $598 | $27,270 | $5,450 | $21,820 |
| 2022 | $577 | $15,900 | $3,180 | $12,720 |
| 2021 | $605 | $15,200 | $3,040 | $12,160 |
| 2020 | $602 | $14,200 | $2,840 | $11,360 |
| 2019 | $579 | $12,630 | $2,520 | $10,110 |
| 2018 | $561 | $10,870 | $2,170 | $8,700 |
| 2017 | $523 | $10,070 | $2,010 | $8,060 |
| 2016 | $504 | $9,300 | $1,860 | $7,440 |
| 2015 | $488 | $8,650 | $1,730 | $6,920 |
Source: Public Records
Map
Nearby Homes
- 630 E Flint St
- 762 E Carla Vista Dr Unit 1
- 874 E Tyson St
- 240 N Monte Vista St
- 625 N Hamilton St Unit 26
- 625 N Hamilton St Unit 27
- 857 E Buffalo St
- 733 E Commonwealth Ave Unit 29
- 982 E Carla Vista Place
- 345 N Colorado St
- 355 N Colorado St
- 868 E Laredo St
- 510 N Jesse Ct
- 291 N Washington St
- 123 N Washington St Unit 22
- 1182 E Erie St
- 488 N Washington St
- 1075 E Chandler Blvd Unit 119
- 472 E Harrison St
- 501 N Arizona Ave
- 689 E Flint St
- 681 E Flint St
- 701 E Flint St
- 673 E Flint St
- 698 E Detroit St
- 688 E Detroit St
- 690 E Flint St
- 680 E Detroit St
- 719 E Flint St
- 680 E Flint St
- 700 E Detroit St
- 665 E Flint St
- 700 E Flint St
- 672 E Detroit St
- 670 E Flint St
- 718 E Detroit St
- 710 E Flint St
- 655 E Flint St
- 664 E Detroit St
- 660 E Flint St
Your Personal Tour Guide
Ask me questions while you tour the home.