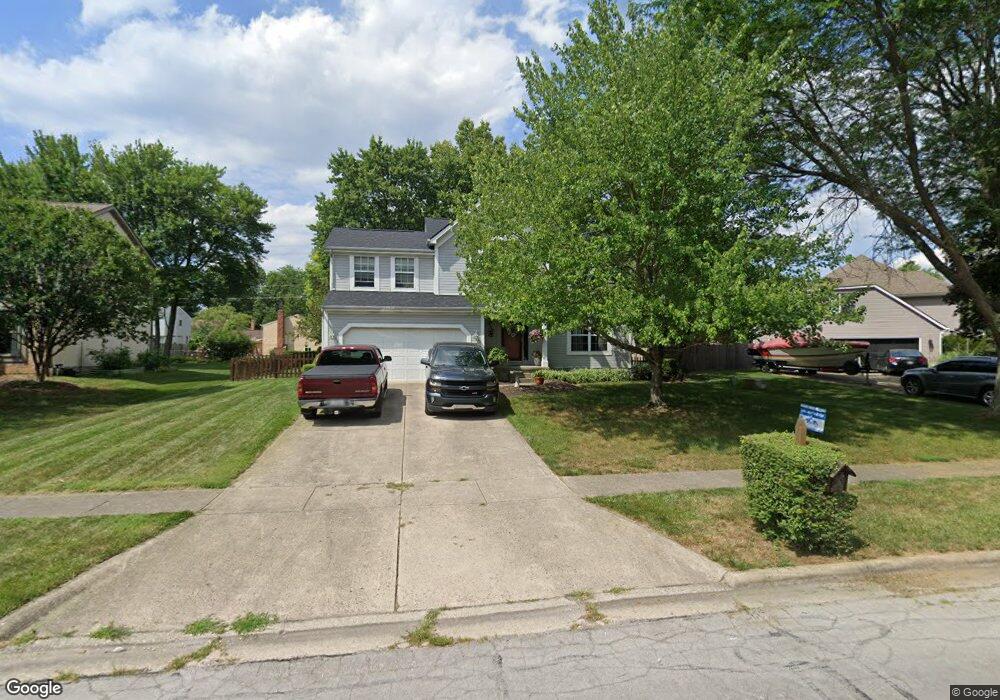
699 Ridenour Rd Columbus, OH 43230
Estimated Value: $445,533 - $475,000
4
Beds
3
Baths
2,320
Sq Ft
$200/Sq Ft
Est. Value
About This Home
This home is located at 699 Ridenour Rd, Columbus, OH 43230 and is currently estimated at $463,133, approximately $199 per square foot. 699 Ridenour Rd is a home located in Franklin County with nearby schools including Chapelfield Elementary School, Gahanna West Middle School, and Lincoln High School.
Ownership History
Date
Name
Owned For
Owner Type
Purchase Details
Closed on
Nov 24, 2023
Sold by
Losinski David A and Conlin-Losinski Valerie J
Bought by
Losinski David A
Current Estimated Value
Home Financials for this Owner
Home Financials are based on the most recent Mortgage that was taken out on this home.
Original Mortgage
$290,000
Interest Rate
6%
Mortgage Type
Credit Line Revolving
Purchase Details
Closed on
Jun 25, 1999
Sold by
Loth Mark R and Loth Karen K
Bought by
Losinski David A and Conlin Losinski Valerie J
Home Financials for this Owner
Home Financials are based on the most recent Mortgage that was taken out on this home.
Original Mortgage
$140,000
Interest Rate
7.29%
Mortgage Type
Balloon
Purchase Details
Closed on
Aug 24, 1992
Bought by
Loth Mark R and Loth Karen K
Create a Home Valuation Report for This Property
The Home Valuation Report is an in-depth analysis detailing your home's value as well as a comparison with similar homes in the area
Purchase History
| Date | Buyer | Sale Price | Title Company |
|---|---|---|---|
| Losinski David A | -- | Heart Of Gold Title | |
| Losinski David A | $183,000 | Chicago Title | |
| Loth Mark R | $157,400 | -- |
Source: Public Records
Mortgage History
| Date | Status | Borrower | Loan Amount |
|---|---|---|---|
| Previous Owner | Losinski David A | $290,000 | |
| Previous Owner | Losinski David A | $140,000 |
Source: Public Records
Tax History
| Year | Tax Paid | Tax Assessment Tax Assessment Total Assessment is a certain percentage of the fair market value that is determined by local assessors to be the total taxable value of land and additions on the property. | Land | Improvement |
|---|---|---|---|---|
| 2025 | $7,876 | $133,700 | $36,750 | $96,950 |
| 2024 | $7,876 | $133,700 | $36,750 | $96,950 |
| 2023 | $7,778 | $133,700 | $36,750 | $96,950 |
| 2022 | $7,345 | $98,360 | $15,720 | $82,640 |
| 2021 | $7,104 | $98,360 | $15,720 | $82,640 |
| 2020 | $7,045 | $98,360 | $15,720 | $82,640 |
| 2019 | $5,831 | $81,240 | $13,130 | $68,110 |
| 2018 | $5,527 | $81,240 | $13,130 | $68,110 |
| 2017 | $5,306 | $81,240 | $13,130 | $68,110 |
| 2016 | $5,261 | $72,740 | $14,530 | $58,210 |
| 2015 | $5,265 | $72,740 | $14,530 | $58,210 |
| 2014 | $5,225 | $72,740 | $14,530 | $58,210 |
| 2013 | $2,594 | $72,730 | $14,525 | $58,205 |
Source: Public Records
Map
Nearby Homes
- 586 Pinegrove Place
- 108 Walcreek Dr W
- 830 Lindenhaven Rd
- 299 Sherwood Meadows Dr
- 536 Springwood Lake Dr
- 956 Crystal Cay Ct
- 464 Foxwood Dr
- 439 Canterwood Ct
- 384 Sandburr Dr
- 475 Denwood Ct
- 3455 Halpern St
- 613 Mistletoe St
- 3877 Hines Rd
- 292 Moorfield Dr
- 388 Elkwood Place
- 0 Wendler Blvd
- 4672 Sperry Ave
- 595 Deerwood Ave E
- 424 Lincolnshire Rd
- 208 Rugby Ln
- 689 Ridenour Rd
- 713 Ridenour Rd
- 255 Carlin Ct W
- 263 Carlin Ct W
- 681 Ridenour Rd
- 247 Carlin Ct W
- 696 Ridenour Rd
- 239 Carlin Ct W
- 684 Ridenour Rd
- 673 Ridenour Rd
- 275 Carlin Ct W
- 256 Carlin Ct W
- 242 Carlin Ct W
- 283 Carlin Ct W
- 248 Carlin Ct W
- 262 Carlin Ct W
- 664 Ridenour Rd
- 728 Ridenour Rd
- 667 Ridenour Rd
- 270 Carlin Ct W
Your Personal Tour Guide
Ask me questions while you tour the home.