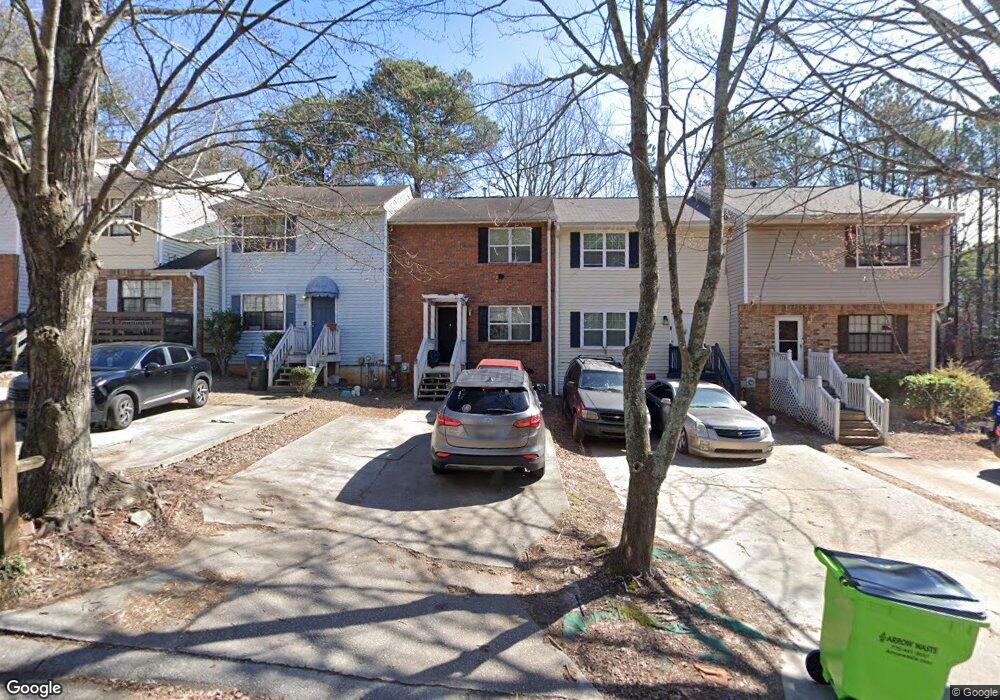
6995 Flagstone Dr Austell, GA 30168
Estimated Value: $139,777 - $212,000
3
Beds
3
Baths
1,000
Sq Ft
$166/Sq Ft
Est. Value
About This Home
This home is located at 6995 Flagstone Dr, Austell, GA 30168 and is currently estimated at $165,944, approximately $165 per square foot. 6995 Flagstone Dr is a home located in Cobb County with nearby schools including Riverside Primary School, Lindley Middle School, and Pebblebrook High School.
Ownership History
Date
Name
Owned For
Owner Type
Purchase Details
Closed on
Mar 5, 2018
Sold by
Santos Avilez
Bought by
Mojica Maurilio and Rodriguez Evelia
Current Estimated Value
Purchase Details
Closed on
Oct 14, 2016
Sold by
Maurilio
Bought by
Avilez Santos and Escobar Ricardo A
Purchase Details
Closed on
May 13, 2016
Sold by
Favors Samuel
Bought by
Mojica Maurilio
Purchase Details
Closed on
Nov 4, 2005
Sold by
Fields Andre W
Bought by
Favors Samuel
Home Financials for this Owner
Home Financials are based on the most recent Mortgage that was taken out on this home.
Original Mortgage
$78,000
Interest Rate
10.3%
Mortgage Type
New Conventional
Purchase Details
Closed on
Sep 30, 1998
Sold by
Beavers Bernice D
Bought by
Fields Andre W
Home Financials for this Owner
Home Financials are based on the most recent Mortgage that was taken out on this home.
Original Mortgage
$67,865
Interest Rate
6.95%
Mortgage Type
New Conventional
Create a Home Valuation Report for This Property
The Home Valuation Report is an in-depth analysis detailing your home's value as well as a comparison with similar homes in the area
Home Values in the Area
Average Home Value in this Area
Purchase History
| Date | Buyer | Sale Price | Title Company |
|---|---|---|---|
| Mojica Maurilio | -- | -- | |
| Avilez Santos | $43,000 | -- | |
| Mojica Maurilio | $27,500 | -- | |
| Favors Samuel | $78,000 | -- | |
| Fields Andre W | $67,900 | -- |
Source: Public Records
Mortgage History
| Date | Status | Borrower | Loan Amount |
|---|---|---|---|
| Previous Owner | Favors Samuel | $78,000 | |
| Previous Owner | Fields Andre W | $67,865 |
Source: Public Records
Tax History
| Year | Tax Paid | Tax Assessment Tax Assessment Total Assessment is a certain percentage of the fair market value that is determined by local assessors to be the total taxable value of land and additions on the property. | Land | Improvement |
|---|---|---|---|---|
| 2025 | $1,857 | $61,620 | $12,000 | $49,620 |
| 2024 | $1,796 | $59,572 | $12,000 | $47,572 |
| 2023 | $1,326 | $43,964 | $6,000 | $37,964 |
Source: Public Records
Map
Nearby Homes
- 6981 Flagstone Dr
- 7039 Fringe Flower Dr Unit 8
- 7080 Fringe Flower Dr Unit 18
- 7074 Oakhill Cir
- 6938 Oakhill Cir
- 0 Cityview Dr SW Unit 10597603
- 201 Wilhelmina Dr
- 6904 Silver Bend Place Unit 4
- 7244 Rockhouse Rd Unit 7
- 306 Bonnes Dr
- 549 Joann Ave
- 179 Silver Arrow Cir
- 750 Six Flags Dr Unit 368
- 90 Kerwood Ct
- 401 S Gordon Rd SW
- 776 Crestside Ct
- 403 Clearstream Ln
- 149 Silver Mine Trail SE
- 7238 Crestside Dr Unit 79
- 6947 Gallant Cir SE Unit 10
- 6995 Flagstone Dr Unit 6995
- 6993 Flagstone Dr Unit 1
- 6997 Flagstone Dr
- 6991 Flagstone Dr Unit 1
- 6991 Flagstone Dr Unit 6991
- 6999 Flagstone Dr
- 6989 Flagstone Dr Unit 1
- 6989 Flagstone Dr
- 6989 Flagstone Dr Unit 935
- 6987 Flagstone Dr
- 6998 Flagstone Dr
- 6985 Flagstone Dr
- 6985 Flagstone Dr Unit 6985
- 7000 Flagstone Dr Unit 1
- 6983 Flagstone Dr Unit 1
- 6996 Flagstone Dr Unit 1
- 6992 Flagstone Dr
- 6990 Flagstone Dr
- 6994 Flagstone Dr Unit 1
- 6979 Flagstone Dr
Your Personal Tour Guide
Ask me questions while you tour the home.