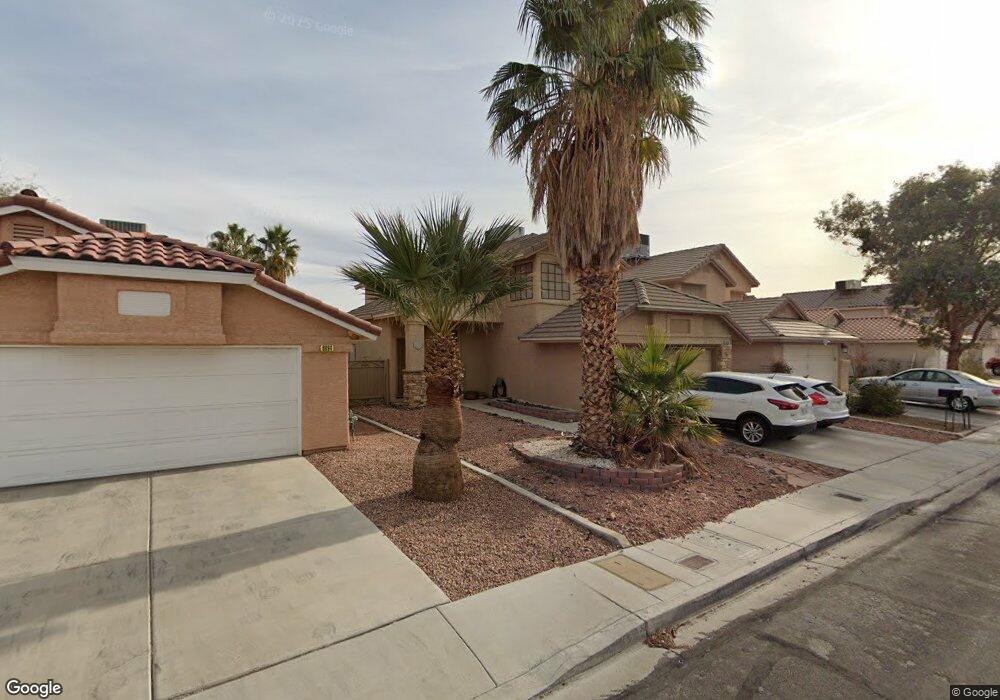
6998 Encore Way Las Vegas, NV 89119
Paradise Valley NeighborhoodEstimated Value: $407,000 - $456,000
3
Beds
3
Baths
1,502
Sq Ft
$286/Sq Ft
Est. Value
About This Home
This home is located at 6998 Encore Way, Las Vegas, NV 89119 and is currently estimated at $429,938, approximately $286 per square foot. 6998 Encore Way is a home located in Clark County with nearby schools including Charlotte Hill Elementary School, Louis Wiener Jr Elementary School, and Jack Lund Schofield Middle School.
Ownership History
Date
Name
Owned For
Owner Type
Purchase Details
Closed on
Jun 8, 2004
Sold by
Miller Scott J
Bought by
Miller Scott J and Francis Cynthia M Miller
Current Estimated Value
Home Financials for this Owner
Home Financials are based on the most recent Mortgage that was taken out on this home.
Original Mortgage
$110,500
Interest Rate
6.09%
Mortgage Type
New Conventional
Purchase Details
Closed on
Feb 20, 1998
Sold by
Francis Cindy M
Bought by
Miller Scott J
Home Financials for this Owner
Home Financials are based on the most recent Mortgage that was taken out on this home.
Original Mortgage
$113,000
Interest Rate
7.11%
Purchase Details
Closed on
Sep 21, 1994
Sold by
Brekke Edelmira C
Bought by
Miller Scott J
Home Financials for this Owner
Home Financials are based on the most recent Mortgage that was taken out on this home.
Original Mortgage
$87,900
Interest Rate
7.5%
Create a Home Valuation Report for This Property
The Home Valuation Report is an in-depth analysis detailing your home's value as well as a comparison with similar homes in the area
Home Values in the Area
Average Home Value in this Area
Purchase History
| Date | Buyer | Sale Price | Title Company |
|---|---|---|---|
| Miller Scott J | -- | Old Republic Title Co Of Ne | |
| Miller Scott J | -- | Fidelity National Title | |
| Miller Scott J | $110,000 | United Title |
Source: Public Records
Mortgage History
| Date | Status | Borrower | Loan Amount |
|---|---|---|---|
| Closed | Miller Scott J | $110,500 | |
| Closed | Miller Scott J | $113,000 | |
| Closed | Miller Scott J | $87,900 |
Source: Public Records
Tax History Compared to Growth
Tax History
| Year | Tax Paid | Tax Assessment Tax Assessment Total Assessment is a certain percentage of the fair market value that is determined by local assessors to be the total taxable value of land and additions on the property. | Land | Improvement |
|---|---|---|---|---|
| 2025 | $1,475 | $87,464 | $32,900 | $54,564 |
| 2024 | $1,433 | $87,464 | $32,900 | $54,564 |
| 2023 | $1,433 | $81,835 | $29,750 | $52,085 |
| 2022 | $1,391 | $69,894 | $21,805 | $48,089 |
| 2021 | $1,351 | $67,744 | $21,700 | $46,044 |
| 2020 | $1,309 | $67,596 | $21,700 | $45,896 |
| 2019 | $1,270 | $64,385 | $18,900 | $45,485 |
| 2018 | $1,233 | $59,464 | $15,400 | $44,064 |
| 2017 | $1,709 | $58,275 | $13,300 | $44,975 |
| 2016 | $1,169 | $55,806 | $10,500 | $45,306 |
| 2015 | $1,166 | $47,425 | $7,000 | $40,425 |
| 2014 | $1,132 | $37,436 | $7,000 | $30,436 |
Source: Public Records
Map
Nearby Homes
- 6881 Tamarus St Unit 202
- 6865 Tamarus St Unit 202
- 6873 Tamarus St Unit 203
- 7126 Sawtooth Dr
- 1466 Finale Ln
- 7135 Sawtooth Dr Unit 2
- 1508 White Dr
- 1138 Placerville St
- 6913 Jasmine Creek Way
- 1252 Little Sidnee Dr
- 7192 Cypress Gardens Ln
- 1233 Little Sidnee Dr
- 1653 Crystal Shadows Cir
- 7384 Emerald Glow St
- 7374 Valhalla Ln
- 7166 Nordic Lights Dr
- 1602 Tulita Dr
- 7164 Paradise Bay Dr
- 2130 E Maule Ave
- 7090 Knoll View Dr
- 7002 Encore Way
- 6994 Encore Way
- 7006 Encore Way
- 7003 Ray Charles Ln
- 7007 Ray Charles Ln
- 7011 Ray Charles Ln
- 7010 Encore Way
- 6999 Encore Way
- 6978 Encore Way Unit 5
- 6993 Encore Way
- 7005 Encore Way
- 7015 Ray Charles Ln
- 6979 Encore Way
- 7009 Encore Way
- 6985 Ray Charles Ln
- 7014 Encore Way
- 6975 Encore Way
- 7011 Encore Way
- 6972 Encore Way
- 7019 Ray Charles Ln