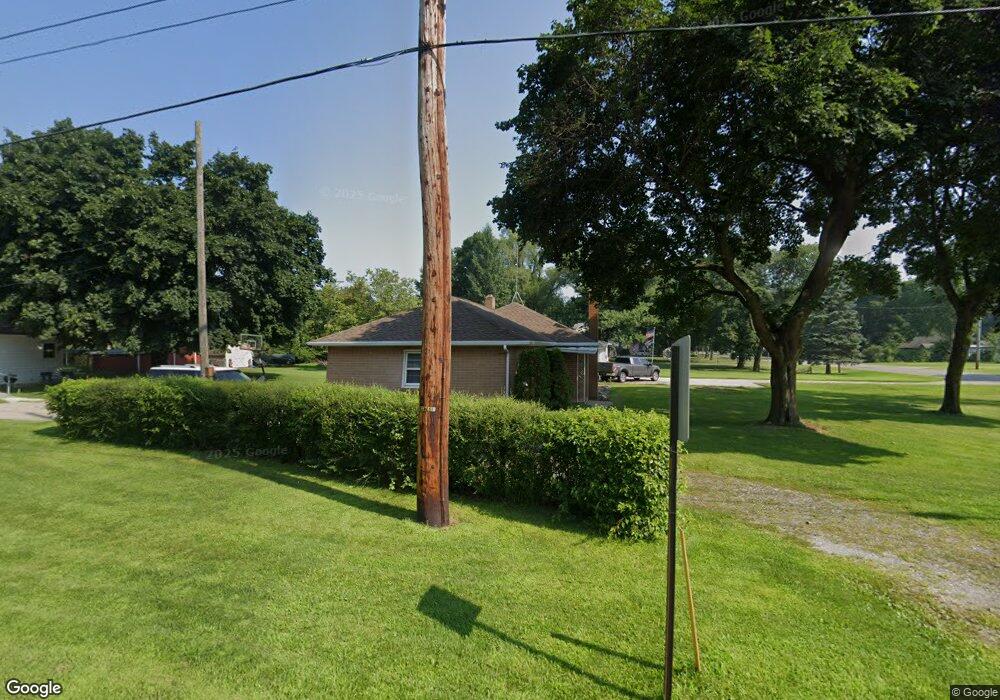
69988 S Nottawa Rd Sturgis, MI 49091
Estimated Value: $193,000 - $264,000
2
Beds
1
Bath
1,348
Sq Ft
$161/Sq Ft
Est. Value
About This Home
This home is located at 69988 S Nottawa Rd, Sturgis, MI 49091 and is currently estimated at $217,340, approximately $161 per square foot. 69988 S Nottawa Rd is a home located in St. Joseph County with nearby schools including Sturgis High School, Sturgis Christian School, and Trinity Lutheran School.
Ownership History
Date
Name
Owned For
Owner Type
Purchase Details
Closed on
Nov 27, 2024
Sold by
Brownridge Virgilene H and Pohl Brenda Jo
Bought by
Meese Robin S
Current Estimated Value
Home Financials for this Owner
Home Financials are based on the most recent Mortgage that was taken out on this home.
Original Mortgage
$85,000
Outstanding Balance
$84,299
Interest Rate
6.54%
Mortgage Type
New Conventional
Estimated Equity
$133,041
Purchase Details
Closed on
Feb 28, 2019
Sold by
Brownridge Virgilene H
Bought by
Brownridge Virgilene H and Pohl Brenda Jo
Purchase Details
Closed on
Aug 20, 2015
Sold by
Brownridge Ross Dale and Brownridge Virgilene B
Bought by
Brownridge Ross and Brownridge Virgilene
Purchase Details
Closed on
Jan 1, 1901
Create a Home Valuation Report for This Property
The Home Valuation Report is an in-depth analysis detailing your home's value as well as a comparison with similar homes in the area
Home Values in the Area
Average Home Value in this Area
Purchase History
| Date | Buyer | Sale Price | Title Company |
|---|---|---|---|
| Meese Robin S | -- | Patrick Abstract & Title | |
| Meese Robin S | -- | Patrick Abstract & Title | |
| Brownridge Virgilene H | -- | None Available | |
| Brownridge Ross | -- | Attorney | |
| -- | -- | -- |
Source: Public Records
Mortgage History
| Date | Status | Borrower | Loan Amount |
|---|---|---|---|
| Open | Meese Robin S | $85,000 | |
| Closed | Meese Robin S | $85,000 |
Source: Public Records
Tax History Compared to Growth
Tax History
| Year | Tax Paid | Tax Assessment Tax Assessment Total Assessment is a certain percentage of the fair market value that is determined by local assessors to be the total taxable value of land and additions on the property. | Land | Improvement |
|---|---|---|---|---|
| 2025 | $1,918 | $95,100 | $6,100 | $89,000 |
| 2024 | $591 | $99,000 | $5,800 | $93,200 |
| 2023 | $563 | $79,100 | $5,400 | $73,700 |
| 2022 | $0 | $67,700 | $5,200 | $62,500 |
| 2021 | $1,697 | $62,200 | $4,900 | $57,300 |
| 2020 | $1,672 | $57,100 | $4,600 | $52,500 |
| 2019 | $1,641 | $51,500 | $3,900 | $47,600 |
| 2018 | $1,463 | $48,600 | $3,900 | $44,700 |
| 2017 | $1,467 | $47,800 | $47,800 | $0 |
| 2016 | -- | $46,100 | $46,100 | $0 |
| 2015 | -- | $46,500 | $0 | $0 |
| 2014 | -- | $44,400 | $44,400 | $0 |
| 2012 | -- | $48,500 | $48,500 | $0 |
Source: Public Records
Map
Nearby Homes
- 27644 E Fawn River Rd
- 69819 S Nottawa Rd
- 539 Fawn River Rd
- 702 S Orange St
- 304 Cottage
- 1387 Flanders St
- 805 Michigan Ave
- 1218 Constitution Ave
- 501 Norwood St
- 104 Mechanic St
- 505 Michigan Ave
- 413 E Congress St
- 210 Grove St
- 302 E Electric Ct
- 501 W Ohio Ct
- 69548 Eisenhower Rd
- 218 Michigan Ave
- 219 S Lakeview St
- 69617 Eisenhower Rd
- 300 Maplecrest Ave
- 69850 S Nottawa Rd
- 69940 S Nottawa Rd
- 69945 S Nottawa Rd
- 69918 S Nottawa Rd
- 69932 S Nottawa Rd
- 69952 S Nottawa Rd
- 69952 S Nottawa Rd
- 69870 S Nottawa Rd
- 69888 S Nottawa Rd
- 69925 S Nottawa Rd
- 0 S Nottawa St
- 69791 Sunnyfield Rd
- 69861 Sunnyfield Rd
- 69955 Sunnyfield Rd
- 70028 S Nottawa Rd
- 69889 S Nottawa Rd
- 69845 S Nottawa Rd
- 69794 S Nottawa Rd
- 69794 S Nottawa Rd
- 69786 S Nottawa Rd