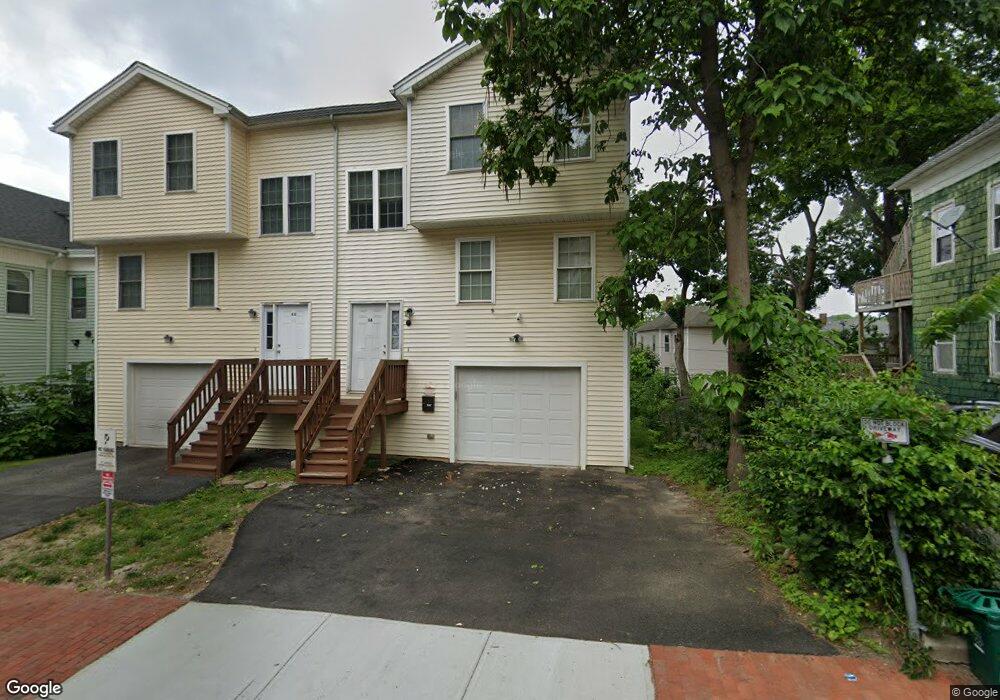
6A Quincy St Worcester, MA 01609
Elm Park NeighborhoodEstimated Value: $367,614 - $418,000
3
Beds
2
Baths
1,454
Sq Ft
$268/Sq Ft
Est. Value
About This Home
This home is located at 6A Quincy St, Worcester, MA 01609 and is currently estimated at $389,404, approximately $267 per square foot. 6A Quincy St is a home located in Worcester County with nearby schools including Jacob Hiatt Magnet School, Chandler Magnet, and Elm Park Elementary School.
Ownership History
Date
Name
Owned For
Owner Type
Purchase Details
Closed on
Jan 21, 2009
Sold by
Hsbc Mortgage Svcs Inc
Bought by
Rurua Francis
Current Estimated Value
Home Financials for this Owner
Home Financials are based on the most recent Mortgage that was taken out on this home.
Original Mortgage
$148,046
Outstanding Balance
$95,214
Interest Rate
5.51%
Mortgage Type
Purchase Money Mortgage
Estimated Equity
$294,190
Purchase Details
Closed on
Jun 17, 2008
Sold by
Ndille Tessa
Bought by
Hsbc Mortgage Svcs Inc
Create a Home Valuation Report for This Property
The Home Valuation Report is an in-depth analysis detailing your home's value as well as a comparison with similar homes in the area
Home Values in the Area
Average Home Value in this Area
Purchase History
| Date | Buyer | Sale Price | Title Company |
|---|---|---|---|
| Rurua Francis | $150,000 | -- | |
| Hsbc Mortgage Svcs Inc | $88,642 | -- |
Source: Public Records
Mortgage History
| Date | Status | Borrower | Loan Amount |
|---|---|---|---|
| Open | Rurua Francis | $148,046 |
Source: Public Records
Tax History
| Year | Tax Paid | Tax Assessment Tax Assessment Total Assessment is a certain percentage of the fair market value that is determined by local assessors to be the total taxable value of land and additions on the property. | Land | Improvement |
|---|---|---|---|---|
| 2025 | $4,288 | $325,100 | $38,200 | $286,900 |
| 2024 | $3,994 | $290,500 | $38,200 | $252,300 |
| 2023 | $3,819 | $266,300 | $30,200 | $236,100 |
| 2022 | $3,545 | $233,100 | $24,200 | $208,900 |
| 2021 | $3,523 | $216,400 | $19,300 | $197,100 |
| 2020 | $3,429 | $201,700 | $19,300 | $182,400 |
| 2019 | $3,321 | $184,500 | $18,400 | $166,100 |
| 2018 | $3,288 | $173,900 | $18,400 | $155,500 |
| 2017 | $3,069 | $159,700 | $18,400 | $141,300 |
| 2016 | $3,129 | $151,800 | $13,600 | $138,200 |
| 2015 | -- | $151,800 | $13,600 | $138,200 |
| 2014 | $2,966 | $151,800 | $13,600 | $138,200 |
Source: Public Records
Map
Nearby Homes
- 10 Congress St Unit 7
- 146 -152 Chandler
- 13 West St
- 14 Ashland St Unit 2R
- 56 Elm St Unit 2
- 12 Winslow St
- 21 Fruit St
- 6 Pelham St
- 4 Preston St
- 2 Preston St
- 709 Main St
- 34 Elm St
- 46 Townsend St
- 17 Federal St Unit 210
- 531 Main St Unit 410
- 531 Main St Unit 403
- 70 Southbridge St Unit 611
- 70 Southbridge St Unit 310
- 29 William St Unit 22
- 7 Bluff St
- 6B Quincy St
- 6 Quincy St
- 6 Quincy St Unit A
- 6 Quincy St Unit 6A
- 4 Quincy St
- 8 Quincy St
- 1 Quincy St
- 1 Quincy St Unit 3E
- 5 Quincy St
- 29 Newbury St
- 2 Quincy St Unit F
- 2 Quincy St Unit E
- 2 Quincy St Unit D
- 2 Quincy St Unit C
- 2 Quincy St Unit B
- 2 Quincy St Unit A
- 2 Quincy St Unit 2-D
- 2 Quincy St Unit G
- 31 Newbury St
- 27 Newbury St
Your Personal Tour Guide
Ask me questions while you tour the home.