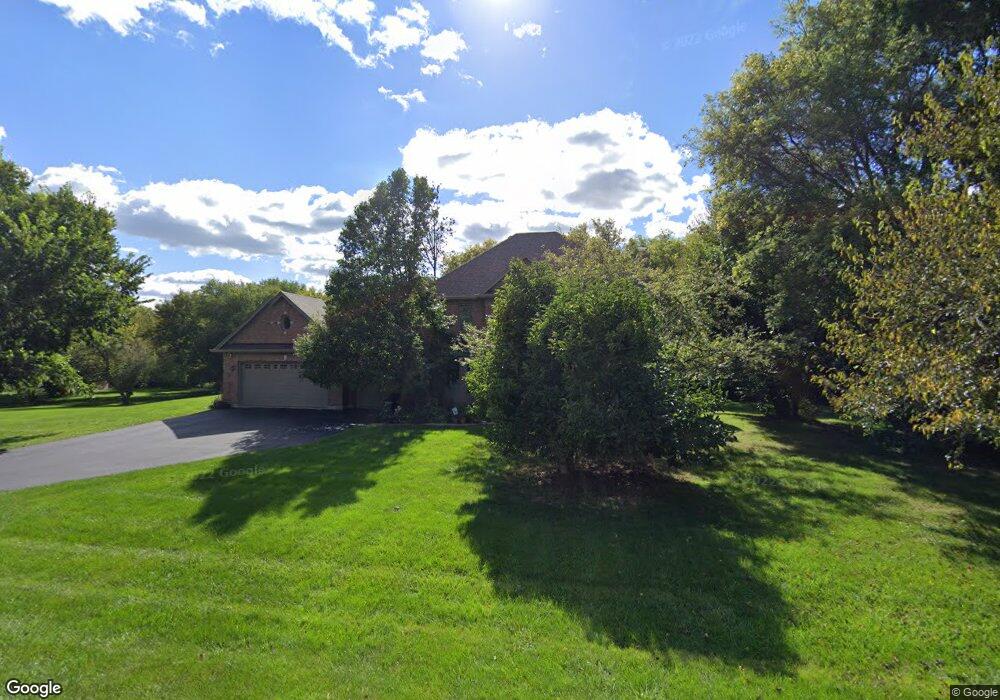
6N320 Barberry Ln Unit 2 Saint Charles, IL 60175
Estimated Value: $544,000 - $704,000
--
Bed
1
Bath
3,635
Sq Ft
$180/Sq Ft
Est. Value
About This Home
This home is located at 6N320 Barberry Ln Unit 2, Saint Charles, IL 60175 and is currently estimated at $654,599, approximately $180 per square foot. 6N320 Barberry Ln Unit 2 is a home located in Kane County with nearby schools including Wasco Elementary School, Thompson Middle School, and St Charles North High School.
Ownership History
Date
Name
Owned For
Owner Type
Purchase Details
Closed on
Sep 15, 2006
Sold by
Smyrniotis Evangeline and Smyrniotis Christopher
Bought by
Smyrniotis Evangeline and Smyrniotis Christopher
Current Estimated Value
Purchase Details
Closed on
Aug 26, 1997
Sold by
Tim Kobler Custom Homes Inc
Bought by
Smyrniotis Christopher and Smyrniotis Evangeline
Home Financials for this Owner
Home Financials are based on the most recent Mortgage that was taken out on this home.
Original Mortgage
$350,000
Outstanding Balance
$53,193
Interest Rate
7.25%
Estimated Equity
$601,406
Purchase Details
Closed on
May 20, 1997
Sold by
Smyrniotis Christopher and Smyrniotis Evangeline
Bought by
Tim Kobler Custom Homes Inc
Home Financials for this Owner
Home Financials are based on the most recent Mortgage that was taken out on this home.
Original Mortgage
$313,600
Interest Rate
8.17%
Create a Home Valuation Report for This Property
The Home Valuation Report is an in-depth analysis detailing your home's value as well as a comparison with similar homes in the area
Home Values in the Area
Average Home Value in this Area
Purchase History
| Date | Buyer | Sale Price | Title Company |
|---|---|---|---|
| Smyrniotis Evangeline | -- | None Available | |
| Smyrniotis Christopher | $312,000 | Chicago Title Insurance Co | |
| Tim Kobler Custom Homes Inc | -- | Chicago Title Insurance Co |
Source: Public Records
Mortgage History
| Date | Status | Borrower | Loan Amount |
|---|---|---|---|
| Open | Smyrniotis Christopher | $350,000 | |
| Previous Owner | Tim Kobler Custom Homes Inc | $313,600 |
Source: Public Records
Tax History Compared to Growth
Tax History
| Year | Tax Paid | Tax Assessment Tax Assessment Total Assessment is a certain percentage of the fair market value that is determined by local assessors to be the total taxable value of land and additions on the property. | Land | Improvement |
|---|---|---|---|---|
| 2024 | $12,655 | $207,465 | $27,260 | $180,205 |
| 2023 | $12,313 | $185,485 | $24,372 | $161,113 |
| 2022 | $11,851 | $169,007 | $22,207 | $146,800 |
| 2021 | $11,118 | $159,576 | $20,968 | $138,608 |
| 2020 | $11,095 | $157,279 | $20,666 | $136,613 |
| 2019 | $10,951 | $154,970 | $20,363 | $134,607 |
| 2018 | $10,935 | $154,970 | $20,363 | $134,607 |
| 2017 | $10,834 | $152,695 | $20,064 | $132,631 |
| 2016 | $11,509 | $148,840 | $19,557 | $129,283 |
| 2015 | -- | $144,730 | $19,017 | $125,713 |
| 2014 | -- | $146,949 | $19,309 | $127,640 |
| 2013 | -- | $149,414 | $19,633 | $129,781 |
Source: Public Records
Map
Nearby Homes
- 41W455 Brierwood Dr
- 5N683 Ravine Dr
- 6N679 Colonel Bennett Ln
- 42W534 Empire Rd
- 40W630 Winchester Way
- 7N072 Willowbrook Dr
- 40W897 Brown Rd
- 42W641 Jens Jensen Ln Unit 2
- 5N634 Lostview Ln
- 42W697 Bridle Ct
- 7N075 Hastings Dr
- 7N107 Hastings Dr
- 5N533 Prairie Springs Dr
- 40W778 Ellis Johnson Ln
- 4N884 Old Lafox Rd
- 40W758 Ellis Johnson Ln
- 24 Autumn Ct
- 40W035 Deer Run Dr
- LOT 1 E Sunset Views Dr
- 4N466 Mark Twain St
- 41W633 Barberry Ln Unit 2
- 6N257 Woodland Rd
- 41W657 Holly Ct
- 6N267 Woodland Rd
- 6N291 Woodland Rd
- 41W624 Barberry Ln
- 6N225 Woodland Rd
- 6N370 Barberry Ln
- 41W631 Holly Ct
- 41W672 Holly Ct
- 6N250 Boxwood Ln
- 6N303 Woodland Rd
- 6N207 Woodland Rd
- 41W584 Woodland Dr Unit 2
- 6N260 Woodland Rd
- 41W642 Holly Ct Unit 2
- 41W593 Holly Ct
- 6N408 Barberry Ln
- 6N407 Barberry Ln
- 6N296 Woodland Rd