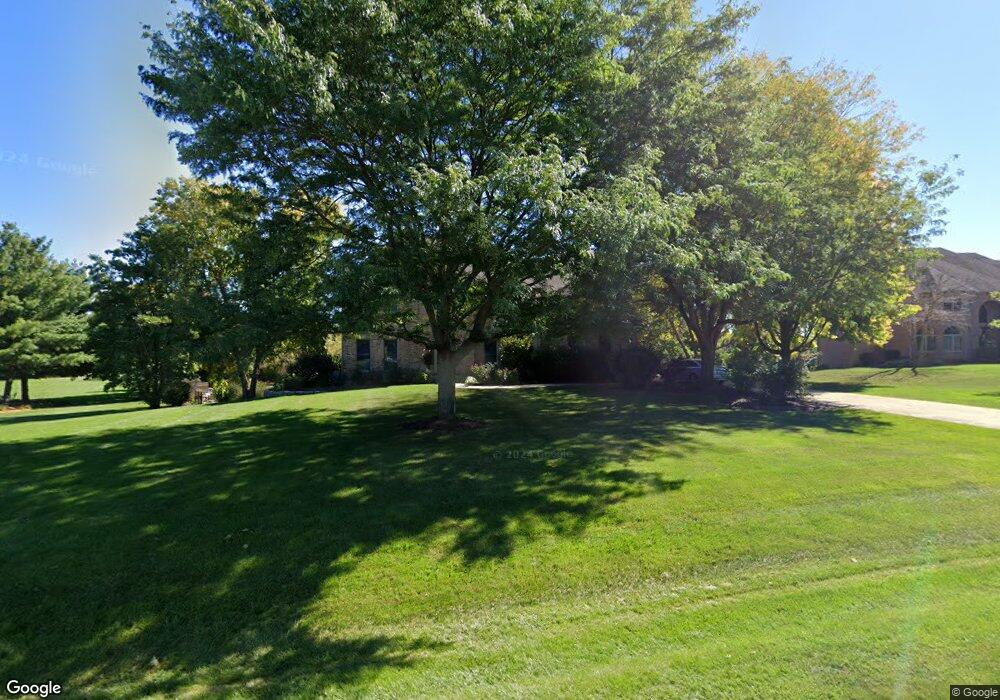
6N759 Colonel Bennett Ln Saint Charles, IL 60175
Estimated Value: $678,550 - $695,000
Studio
1
Bath
2,965
Sq Ft
$232/Sq Ft
Est. Value
About This Home
This home is located at 6N759 Colonel Bennett Ln, Saint Charles, IL 60175 and is currently estimated at $687,638, approximately $231 per square foot. 6N759 Colonel Bennett Ln is a home located in Kane County with nearby schools including Wasco Elementary School, Thompson Middle School, and St Charles North High School.
Ownership History
Date
Name
Owned For
Owner Type
Purchase Details
Closed on
May 7, 2018
Sold by
Clawson George R and Clawson Melinda M Hays
Bought by
Clawson Melinda M Hayes
Current Estimated Value
Purchase Details
Closed on
Jun 15, 2002
Sold by
Clawson George R and Hays Clawson Melinda M
Bought by
Clawson George R and Hays Clawson Melinda M
Purchase Details
Closed on
Jan 9, 2002
Sold by
Hays Clawson Melinda M
Bought by
Clawson George R and Hays Clawson Melinda M
Home Financials for this Owner
Home Financials are based on the most recent Mortgage that was taken out on this home.
Original Mortgage
$133,000
Interest Rate
7.24%
Purchase Details
Closed on
Mar 1, 1996
Sold by
Clawson George R and Hays Clawson Melinda M
Bought by
Hays Clawson Melinda M
Create a Home Valuation Report for This Property
The Home Valuation Report is an in-depth analysis detailing your home's value as well as a comparison with similar homes in the area
Home Values in the Area
Average Home Value in this Area
Purchase History
| Date | Buyer | Sale Price | Title Company |
|---|---|---|---|
| Clawson Melinda M Hayes | -- | Attorney | |
| Clawson George R | -- | -- | |
| Clawson George R | -- | Mid America Title Company | |
| Hays Clawson Melinda M | -- | Chicago Title Insurance Co |
Source: Public Records
Mortgage History
| Date | Status | Borrower | Loan Amount |
|---|---|---|---|
| Closed | Clawson George R | $133,000 |
Source: Public Records
Tax History
| Year | Tax Paid | Tax Assessment Tax Assessment Total Assessment is a certain percentage of the fair market value that is determined by local assessors to be the total taxable value of land and additions on the property. | Land | Improvement |
|---|---|---|---|---|
| 2024 | $12,772 | $201,238 | $28,502 | $172,736 |
| 2023 | $12,490 | $179,917 | $25,482 | $154,435 |
| 2022 | $11,846 | $163,933 | $23,218 | $140,715 |
| 2021 | $11,133 | $154,785 | $21,922 | $132,863 |
| 2020 | $11,116 | $152,558 | $21,607 | $130,951 |
| 2019 | $10,978 | $150,318 | $21,290 | $129,028 |
| 2018 | $10,962 | $150,318 | $21,290 | $129,028 |
| 2017 | $10,866 | $148,111 | $20,977 | $127,134 |
| 2016 | $11,553 | $144,371 | $20,447 | $123,924 |
| 2015 | -- | $140,384 | $19,882 | $120,502 |
| 2014 | -- | $133,338 | $20,187 | $113,151 |
| 2013 | -- | $135,575 | $20,526 | $115,049 |
Source: Public Records
Map
Nearby Homes
- 7N072 Willowbrook Dr
- 7N108 Hastings Dr
- 40W412 Winchester Way
- 6N530 Crestwood Dr
- 41W461 Burlington Rd
- 39W796 Dairyherd Ln Unit 1
- 41W331 Empire Rd
- 40W789 Whitney Rd
- 6N680 Somerset Dr
- 1857 Chandolin Ln
- 1865 Chandolin Ln
- 1863 Chandolin Ln
- 1867 Chandolin Ln
- 1858 Chandolin Ln
- 1854 Chandolin Ln
- 1847 Diamond Dr
- 1855 Diamond Dr
- 1851 Diamond Dr
- 3620 Sahara Rd
- 1849 Diamond Dr
- 6N735 Colonel Bennett Ln
- 6N785 Colonel Bennett Ln
- 6N782 Colonel Bennett Ln
- 6N727 Colonel Bennett Ln
- 6N728 Colonel Bennett Ln
- 6N694 Willowbrook Dr
- 6N724 Willowbrook Dr
- 40W601 Willowbrook Dr
- 40W723 Willowbrook Dr
- 6N762 Willowbrook Dr
- 6N665 Willowbrook Dr
- 6N810 Willowbrook Dr
- 6N722 Colonel Bennett Ln
- 40W654 Willowbrook Dr
- 40W682 Willowbrook Dr
- 40W638 Aberdeen Ln
- 6N874 Balmoral Ln
- 6N642 Willowbrook Dr
- 40W759 Willowbrook Dr
- 6N705 Willowbrook Dr
Your Personal Tour Guide
Ask me questions while you tour the home.