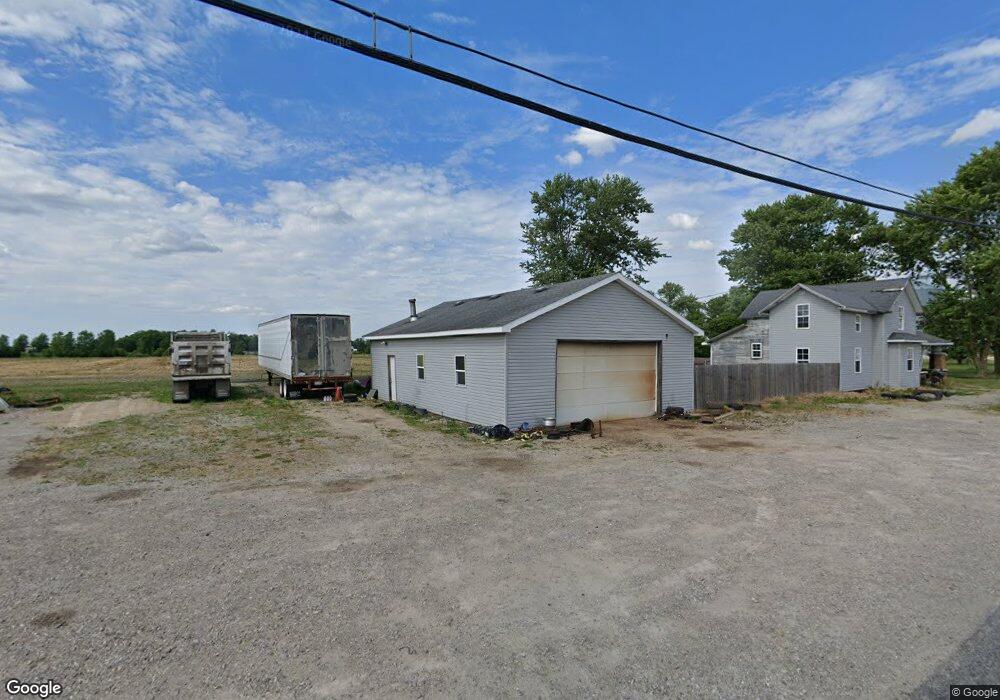
7-064 County Road M Grelton, OH 43523
Estimated Value: $53,000 - $109,000
4
Beds
1
Bath
1,870
Sq Ft
$39/Sq Ft
Est. Value
About This Home
This home is located at 7-064 County Road M, Grelton, OH 43523 and is currently estimated at $73,000, approximately $39 per square foot. 7-064 County Road M is a home located in Henry County with nearby schools including Patrick Henry Middle School and Patrick Henry High School.
Ownership History
Date
Name
Owned For
Owner Type
Purchase Details
Closed on
Dec 18, 2015
Sold by
Joy Charles L and Joy Betty L
Bought by
Joy Caleb
Current Estimated Value
Home Financials for this Owner
Home Financials are based on the most recent Mortgage that was taken out on this home.
Original Mortgage
$16,000
Outstanding Balance
$480
Interest Rate
3.88%
Mortgage Type
New Conventional
Estimated Equity
$72,520
Purchase Details
Closed on
Aug 8, 2014
Sold by
Hesterman Bruce A and Hesterman Sherri L
Bought by
Hesterman Bruce A and Hesterman Sherri L
Purchase Details
Closed on
Oct 31, 2003
Sold by
Hill Guy W and Hill Kimberly L
Bought by
Joy Charles L and Joy Betty L
Purchase Details
Closed on
Dec 17, 2002
Sold by
Carpenter Scott A
Bought by
Farmers & Merchants State Bank
Create a Home Valuation Report for This Property
The Home Valuation Report is an in-depth analysis detailing your home's value as well as a comparison with similar homes in the area
Home Values in the Area
Average Home Value in this Area
Purchase History
| Date | Buyer | Sale Price | Title Company |
|---|---|---|---|
| Joy Caleb | $20,000 | Attorney | |
| Hesterman Bruce A | -- | Attorney | |
| Hesterman Bruce A | -- | Attorney | |
| Joy Charles L | $28,000 | -- | |
| Hill Guy W | $25,000 | -- | |
| Farmers & Merchants State Bank | $26,000 | -- |
Source: Public Records
Mortgage History
| Date | Status | Borrower | Loan Amount |
|---|---|---|---|
| Open | Joy Caleb | $16,000 |
Source: Public Records
Tax History Compared to Growth
Tax History
| Year | Tax Paid | Tax Assessment Tax Assessment Total Assessment is a certain percentage of the fair market value that is determined by local assessors to be the total taxable value of land and additions on the property. | Land | Improvement |
|---|---|---|---|---|
| 2024 | $679 | $18,270 | $9,960 | $8,310 |
| 2023 | $679 | $18,270 | $9,960 | $8,310 |
| 2022 | $634 | $28,340 | $17,260 | $11,080 |
| 2021 | $644 | $14,220 | $8,630 | $5,590 |
| 2020 | $693 | $14,220 | $8,630 | $5,590 |
| 2019 | $592 | $12,990 | $8,220 | $4,770 |
| 2018 | $614 | $12,990 | $8,220 | $4,770 |
| 2017 | $578 | $12,990 | $8,220 | $4,770 |
| 2016 | $560 | $12,920 | $8,140 | $4,780 |
| 2015 | $1,020 | $24,340 | $8,140 | $16,200 |
| 2014 | $881 | $20,070 | $8,550 | $11,520 |
| 2013 | $881 | $20,070 | $8,550 | $11,520 |
Source: Public Records
Map
Nearby Homes
- 7242 Township Road 117
- 208 N Henry St
- 104 S Turkey Foot Ave
- 440 Vine St
- 325 E North St
- 335 E North St
- 9173 County Road P3
- H737 County Road 8
- 3374 County Road J
- N-839 County Road 11c County Rd
- 465 Oxford St
- 657 Euclid Ave
- 445 Oxford St
- 455 Oxford St
- 639 Beckham St
- 12724 County Road P
- 100 Cliff St
- 1260 E Riverview Ave
- S261 County Road 4
- 433 E Main St
- 7064 County Road M
- 7083 County Road M
- M015 County Road 7
- 58 Clifton St
- M023 County Road 7
- M037 County Road 7
- M061 County Road 7
- L961 County Road 7
- 75 Clifton St
- 7161 County Road M
- 73 Clifton St
- 55 Clifton St
- 43 Clifton St
- M073 County Road 7
- M089 County Road 7
- L917 County Road 7
- M-094 County Road 7
- L883 County Road 7
- L953 County Road 7
- 799 County Rd 7