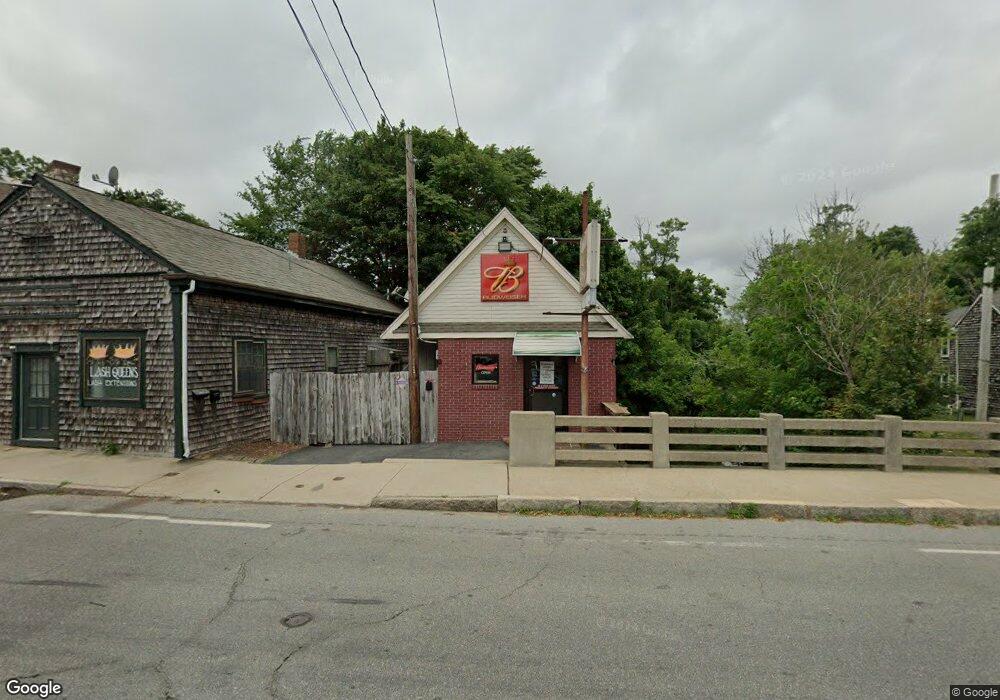
7 1/2 Tarkiln Hill Rd Acushnet, MA 02743
Coury Heights NeighborhoodEstimated Value: $293,946
--
Bed
2
Baths
912
Sq Ft
$322/Sq Ft
Est. Value
About This Home
This home is located at 7 1/2 Tarkiln Hill Rd, Acushnet, MA 02743 and is currently estimated at $293,946, approximately $322 per square foot. 7 1/2 Tarkiln Hill Rd is a home located in Bristol County with nearby schools including Acushnet Elementary School, Albert F Ford Middle School, and Alma Del Mar Charter School.
Ownership History
Date
Name
Owned For
Owner Type
Purchase Details
Closed on
Aug 29, 2024
Sold by
Desilva Mark M and Desilva Susan J
Bought by
Jem Properties Llc
Current Estimated Value
Purchase Details
Closed on
Nov 18, 2004
Sold by
Nordstrom Barbara E
Bought by
Desilva Mark M and Desilva Susan J
Purchase Details
Closed on
May 19, 2004
Sold by
Hardy Everett L and Hardy Marie M
Bought by
Nordstrom Barbara
Create a Home Valuation Report for This Property
The Home Valuation Report is an in-depth analysis detailing your home's value as well as a comparison with similar homes in the area
Home Values in the Area
Average Home Value in this Area
Purchase History
| Date | Buyer | Sale Price | Title Company |
|---|---|---|---|
| Jem Properties Llc | $275,000 | None Available | |
| Jem Properties Llc | $275,000 | None Available | |
| Desilva Mark M | $165,000 | -- | |
| Desilva Mark M | $165,000 | -- | |
| Nordstrom Barbara | $110,000 | -- | |
| Nordstrom Barbara | $110,000 | -- |
Source: Public Records
Tax History Compared to Growth
Tax History
| Year | Tax Paid | Tax Assessment Tax Assessment Total Assessment is a certain percentage of the fair market value that is determined by local assessors to be the total taxable value of land and additions on the property. | Land | Improvement |
|---|---|---|---|---|
| 2025 | $3,109 | $204,300 | $132,300 | $72,000 |
| 2024 | $3,057 | $189,500 | $122,100 | $67,400 |
| 2023 | $2,966 | $174,700 | $111,900 | $62,800 |
| 2022 | $2,761 | $160,700 | $101,800 | $58,900 |
| 2021 | $2,870 | $160,700 | $101,800 | $58,900 |
| 2020 | $2,885 | $160,700 | $101,800 | $58,900 |
| 2019 | $2,644 | $145,300 | $87,500 | $57,800 |
| 2018 | $2,633 | $142,300 | $84,500 | $57,800 |
| 2017 | $2,611 | $142,300 | $84,500 | $57,800 |
| 2016 | $2,634 | $141,600 | $84,500 | $57,100 |
| 2015 | $2,588 | $141,600 | $84,500 | $57,100 |
Source: Public Records
Map
Nearby Homes