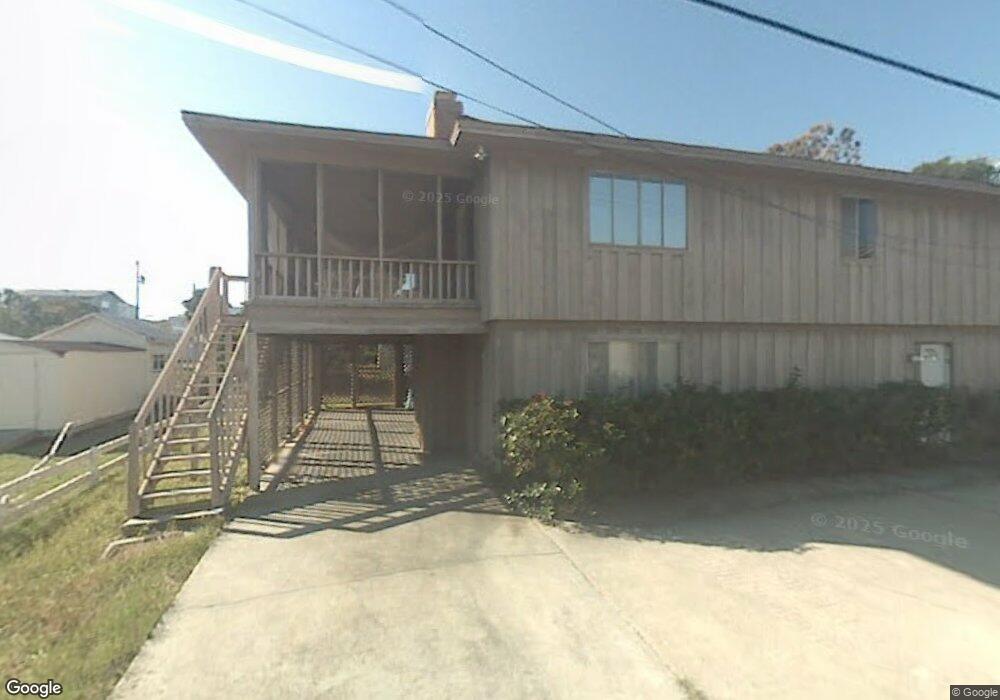
7 10th Ct Tybee Island, GA 31328
Estimated Value: $823,520 - $1,269,000
3
Beds
4
Baths
2,440
Sq Ft
$427/Sq Ft
Est. Value
About This Home
This home is located at 7 10th Ct, Tybee Island, GA 31328 and is currently estimated at $1,041,380, approximately $426 per square foot. 7 10th Ct is a home with nearby schools including Howard Elementary School, Coastal Middle School, and Islands High School.
Ownership History
Date
Name
Owned For
Owner Type
Purchase Details
Closed on
Feb 20, 2015
Sold by
Ssf Tybee Llc
Bought by
Gretenstein Steven and Shrut Barbara
Current Estimated Value
Purchase Details
Closed on
Dec 28, 2012
Sold by
Solomons Cathy E
Bought by
Solomons Philip and Solomons Cathy E Qualified Per
Purchase Details
Closed on
Mar 29, 2010
Sold by
Heritagebank Of The South
Bought by
Ssf Tybee Llc
Purchase Details
Closed on
Dec 10, 2008
Sold by
Not Provided
Bought by
Ssf Tybee Llc
Create a Home Valuation Report for This Property
The Home Valuation Report is an in-depth analysis detailing your home's value as well as a comparison with similar homes in the area
Home Values in the Area
Average Home Value in this Area
Purchase History
| Date | Buyer | Sale Price | Title Company |
|---|---|---|---|
| Gretenstein Steven | $560,000 | -- | |
| Solomons Philip | -- | -- | |
| Solomons Cathy E | -- | -- | |
| Ssf Tybee Llc | $310,000 | -- | |
| Heritagebank Of The South | -- | -- | |
| Ssf Tybee Llc | $601,261 | -- |
Source: Public Records
Tax History Compared to Growth
Tax History
| Year | Tax Paid | Tax Assessment Tax Assessment Total Assessment is a certain percentage of the fair market value that is determined by local assessors to be the total taxable value of land and additions on the property. | Land | Improvement |
|---|---|---|---|---|
| 2025 | $9,177 | $325,640 | $180,000 | $145,640 |
| 2024 | $9,177 | $292,320 | $180,000 | $112,320 |
| 2023 | $9,264 | $292,320 | $180,000 | $112,320 |
| 2022 | $7,097 | $292,320 | $180,000 | $112,320 |
| 2021 | $7,038 | $211,160 | $99,840 | $111,320 |
| 2020 | $7,212 | $209,920 | $92,160 | $117,760 |
| 2019 | $7,212 | $209,920 | $92,160 | $117,760 |
| 2018 | $6,552 | $203,360 | $92,160 | $111,200 |
| 2017 | $6,552 | $203,360 | $92,160 | $111,200 |
| 2016 | $4,985 | $203,360 | $92,160 | $111,200 |
| 2015 | $4,993 | $154,720 | $92,160 | $62,560 |
| 2014 | $7,385 | $154,720 | $0 | $0 |
Source: Public Records
Map
Nearby Homes