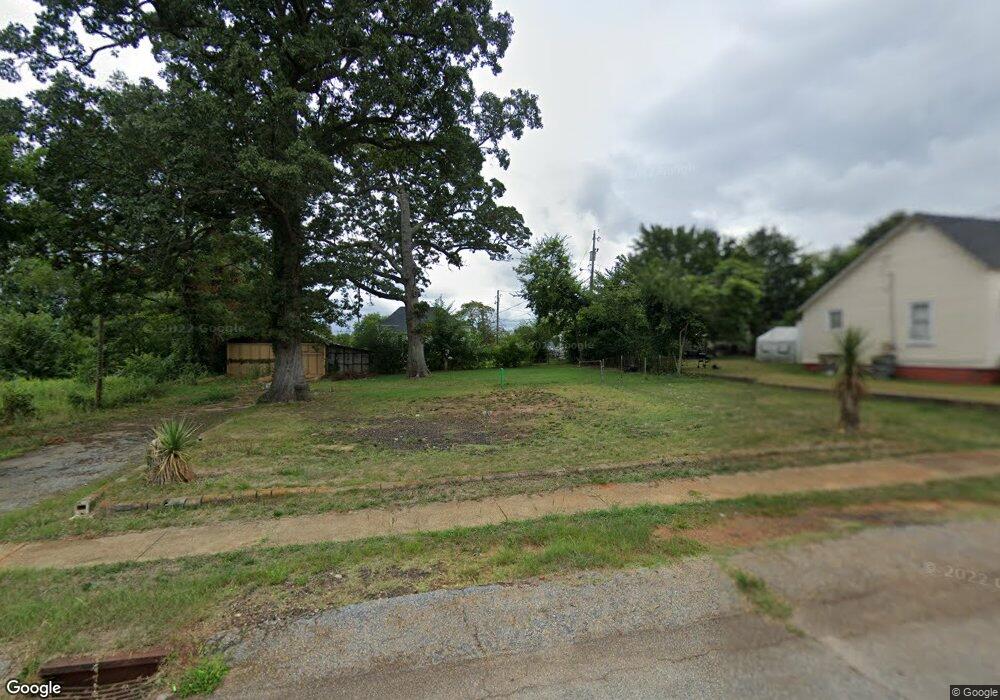
7 2nd Ave Greenville, SC 29609
North Greenville NeighborhoodEstimated Value: $80,000 - $263,000
2
Beds
1
Bath
944
Sq Ft
$152/Sq Ft
Est. Value
About This Home
This home is located at 7 2nd Ave, Greenville, SC 29609 and is currently estimated at $143,333, approximately $151 per square foot. 7 2nd Ave is a home located in Greenville County with nearby schools including Cherrydale Elementary, Lakeview Middle, and Greenville Senior High School.
Ownership History
Date
Name
Owned For
Owner Type
Purchase Details
Closed on
Dec 29, 2020
Sold by
Cosgrove Kenneth B
Bought by
Overhill Llc
Current Estimated Value
Purchase Details
Closed on
Dec 21, 2020
Sold by
Kane Joseph T
Bought by
Overhill Llc
Purchase Details
Closed on
Mar 27, 2017
Sold by
Sweetbriar Properties Llc and Kane Joseph T
Bought by
Jkc Holdings Llc
Purchase Details
Closed on
Mar 15, 2016
Sold by
Sweetbriar Properties Llc
Bought by
Kane Joseph
Purchase Details
Closed on
Feb 25, 2016
Sold by
Cosgrove Kenneth B
Bought by
Sweetbriar Properties Llc
Purchase Details
Closed on
Oct 20, 2015
Sold by
J B Lacher Inc
Bought by
Cox Patrick
Purchase Details
Closed on
Oct 8, 2015
Sold by
Holland Victoria and Clardy Victoria H
Bought by
Cosgrove Kenneth B
Purchase Details
Closed on
Jan 8, 2010
Sold by
Smith Betty H
Bought by
Holland Victoria and Clardy Victoria H
Purchase Details
Closed on
Aug 5, 1999
Sold by
Master In Equity
Bought by
Smith Betty
Create a Home Valuation Report for This Property
The Home Valuation Report is an in-depth analysis detailing your home's value as well as a comparison with similar homes in the area
Home Values in the Area
Average Home Value in this Area
Purchase History
| Date | Buyer | Sale Price | Title Company |
|---|---|---|---|
| Overhill Llc | -- | None Available | |
| Overhill Llc | $50,000 | None Available | |
| Kane Joseph T | $44,320 | None Available | |
| Jkc Holdings Llc | -- | None Available | |
| Kane Joseph | $20,000 | None Available | |
| Sweetbriar Properties Llc | -- | None Available | |
| Sweetbriar Properties Llc | -- | None Available | |
| Cox Patrick | $78,000 | None Available | |
| Cosgrove Kenneth B | $35,000 | None Available | |
| Holland Victoria | $34,405 | -- | |
| Smith Betty | $30,000 | -- |
Source: Public Records
Tax History Compared to Growth
Tax History
| Year | Tax Paid | Tax Assessment Tax Assessment Total Assessment is a certain percentage of the fair market value that is determined by local assessors to be the total taxable value of land and additions on the property. | Land | Improvement |
|---|---|---|---|---|
| 2024 | $267 | $570 | $570 | $0 |
| 2023 | $267 | $570 | $570 | $0 |
| 2022 | $444 | $570 | $570 | $0 |
| 2021 | $1,305 | $2,810 | $570 | $2,240 |
| 2020 | $1,387 | $2,660 | $570 | $2,090 |
| 2019 | $1,367 | $2,660 | $570 | $2,090 |
| 2018 | $1,243 | $2,660 | $570 | $2,090 |
| 2017 | $1,230 | $2,660 | $570 | $2,090 |
| 2016 | $1,178 | $44,320 | $9,500 | $34,820 |
| 2015 | $1,178 | $44,320 | $9,500 | $34,820 |
| 2014 | $573 | $38,561 | $10,073 | $28,488 |
Source: Public Records
Map
Nearby Homes