Estimated Value: $253,000
3
Beds
5
Baths
4,800
Sq Ft
$53/Sq Ft
Est. Value
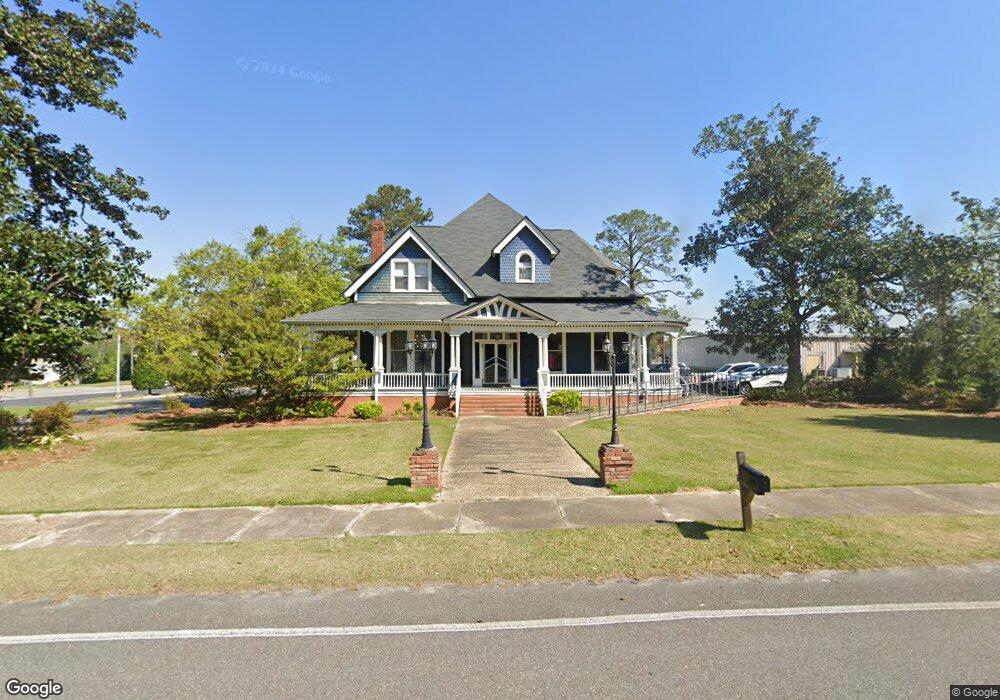
About This Home
This home is located at 7 3rd Ave SE, Cairo, GA 39828 and is currently estimated at $253,000, approximately $52 per square foot. 7 3rd Ave SE is a home located in Grady County with nearby schools including Cairo High School.
Ownership History
Date
Name
Owned For
Owner Type
Purchase Details
Closed on
Mar 26, 2014
Sold by
Capital City Bank
Bought by
Ridenour Robert W and Ridenour Meghan A
Current Estimated Value
Home Financials for this Owner
Home Financials are based on the most recent Mortgage that was taken out on this home.
Original Mortgage
$72,900
Outstanding Balance
$39,168
Interest Rate
4.4%
Mortgage Type
New Conventional
Estimated Equity
$213,832
Purchase Details
Closed on
Nov 15, 2011
Sold by
Simmons Perry
Bought by
Capital City Bank
Purchase Details
Closed on
Oct 25, 1999
Bought by
Simmons Dr Perry
Purchase Details
Closed on
Apr 7, 1998
Sold by
Walden Daisy
Bought by
United Companies Lending
Purchase Details
Closed on
Mar 28, 1997
Sold by
Bray H T
Bought by
Walden Daisy
Purchase Details
Closed on
Apr 11, 1995
Sold by
Laud & Revere Inc
Bought by
Bray H T
Purchase Details
Closed on
Aug 3, 1993
Bought by
Laud & Revere Inc
Create a Home Valuation Report for This Property
The Home Valuation Report is an in-depth analysis detailing your home's value as well as a comparison with similar homes in the area
Purchase History
| Date | Buyer | Sale Price | Title Company |
|---|---|---|---|
| Ridenour Robert W | $81,000 | -- | |
| Capital City Bank | -- | -- | |
| Simmons Dr Perry | $87,000 | -- | |
| United Companies Lending | $195,000 | -- | |
| Walden Daisy | $195,000 | -- | |
| Bray H T | $100,000 | -- | |
| Laud & Revere Inc | $63,000 | -- |
Source: Public Records
Mortgage History
| Date | Status | Borrower | Loan Amount |
|---|---|---|---|
| Open | Ridenour Robert W | $72,900 |
Source: Public Records
Tax History
| Year | Tax Paid | Tax Assessment Tax Assessment Total Assessment is a certain percentage of the fair market value that is determined by local assessors to be the total taxable value of land and additions on the property. | Land | Improvement |
|---|---|---|---|---|
| 2024 | $2,308 | $87,830 | $18,581 | $69,249 |
| 2023 | $1,961 | $52,978 | $6,757 | $46,221 |
| 2022 | $2,040 | $52,978 | $6,757 | $46,221 |
| 2021 | $2,045 | $52,978 | $6,757 | $46,221 |
| 2020 | $2,051 | $52,978 | $6,757 | $46,221 |
| 2019 | $2,050 | $52,978 | $6,757 | $46,221 |
| 2018 | $1,949 | $52,978 | $6,757 | $46,221 |
| 2017 | $1,874 | $52,978 | $6,757 | $46,221 |
| 2016 | $1,676 | $46,335 | $6,757 | $39,578 |
| 2015 | $1,161 | $46,335 | $6,757 | $39,578 |
| 2014 | -- | $46,335 | $6,757 | $39,578 |
| 2013 | -- | $75,440 | $16,490 | $58,950 |
Source: Public Records
Map
Nearby Homes
- 00 Hwy 111 South Tract 1
- X 1st St
- 0 1st St
- 309 3rd St SE
- 4761 Hadley Ferry Rd
- 460 2nd St SW
- 00 Blackberry Ln
- 00 Meridian Rd
- 580 5th St SE
- 530 6th Ave SE
- 125 6th Ave NW
- 112 Pine Cir SW
- 00 00 Hwy 111 South Tract 2
- 711 2nd Ave NE
- 117 SW Pine Cirlce
- 320 8th St SW
- 1193 S Broad St
- 0 Georgia 111
- 2975 U S 84
- 220 8th Ave NW
- 220 1st St SE
- 305 1st St SE
- 210 2nd Ave SE Unit 1
- 210 2nd Ave SE
- 307 2nd St SE
- 14 3rd Ave SW
- 19 4th Ave SE
- 19 4th Ave SE
- 19 4th Ave SE
- 21 Martin Luther King Junior Ave Unit 11
- 21 Martin Luther King Junior Ave Unit 21
- 21 Martin Luther King Junior Ave Unit 15
- 21 Martin Luther King Junior Ave
- 21 Martin Luther King Junior Ave Unit 17
- 21 Martin Luther King jr Ave SW Unit 17
- 21 Martin Luther King jr Ave SW
- 318 S Broad St
- 111 4th Ave SE
- 205 2nd St SE
- 22 3rd Ave SW
Your Personal Tour Guide
Ask me questions while you tour the home.