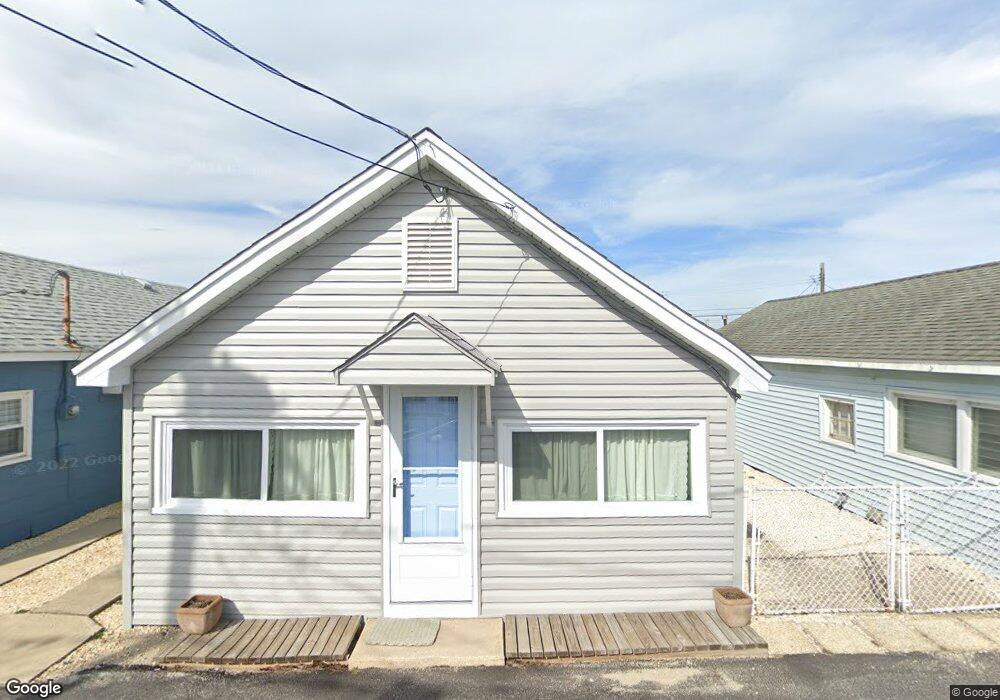
7 4th Ln Seaside Park, NJ 08752
Estimated Value: $454,000 - $611,000
2
Beds
1
Bath
576
Sq Ft
$943/Sq Ft
Est. Value
About This Home
This home is located at 7 4th Ln, Seaside Park, NJ 08752 and is currently estimated at $543,059, approximately $942 per square foot. 7 4th Ln is a home located in Ocean County with nearby schools including Central Regional Middle School and Central Regional High School.
Ownership History
Date
Name
Owned For
Owner Type
Purchase Details
Closed on
Jun 25, 2021
Sold by
Hogan Robert and Hogan Tracey
Bought by
Argonish John A and Argonish Gina
Current Estimated Value
Home Financials for this Owner
Home Financials are based on the most recent Mortgage that was taken out on this home.
Original Mortgage
$250,000
Outstanding Balance
$224,362
Interest Rate
2.9%
Mortgage Type
New Conventional
Estimated Equity
$318,697
Purchase Details
Closed on
Oct 12, 2000
Create a Home Valuation Report for This Property
The Home Valuation Report is an in-depth analysis detailing your home's value as well as a comparison with similar homes in the area
Home Values in the Area
Average Home Value in this Area
Purchase History
| Date | Buyer | Sale Price | Title Company |
|---|---|---|---|
| Argonish John A | $380,000 | Land Title | |
| Argonish John A | $380,000 | Land Title | |
| -- | $64,000 | -- |
Source: Public Records
Mortgage History
| Date | Status | Borrower | Loan Amount |
|---|---|---|---|
| Open | Argonish John A | $250,000 | |
| Closed | Argonish John A | $250,000 |
Source: Public Records
Tax History
| Year | Tax Paid | Tax Assessment Tax Assessment Total Assessment is a certain percentage of the fair market value that is determined by local assessors to be the total taxable value of land and additions on the property. | Land | Improvement |
|---|---|---|---|---|
| 2025 | $7,900 | $305,000 | $256,000 | $49,000 |
| 2024 | $7,076 | $305,000 | $256,000 | $49,000 |
| 2023 | $6,945 | $305,000 | $256,000 | $49,000 |
| 2022 | $6,945 | $305,000 | $256,000 | $49,000 |
| 2021 | $6,741 | $305,000 | $256,000 | $49,000 |
| 2020 | $6,798 | $305,000 | $256,000 | $49,000 |
| 2019 | $6,609 | $305,000 | $256,000 | $49,000 |
| 2018 | $6,588 | $305,000 | $256,000 | $49,000 |
| 2017 | $6,885 | $331,000 | $282,000 | $49,000 |
| 2016 | $6,848 | $331,000 | $282,000 | $49,000 |
| 2015 | $6,660 | $331,000 | $282,000 | $49,000 |
| 2014 | $6,471 | $331,000 | $282,000 | $49,000 |
Source: Public Records
Map
Nearby Homes
- 2200 S Ocean Ave Unit 304
- 19 9th Ln
- 1453 Barnegat Ave
- 23 Miller's Ln
- 22 21st Ave
- 210 Midway Ave
- 809 S Ocean Ave
- 31 1st Ln Unit 1
- 103 23rd Ave Unit 11
- 363 Roberts Ave
- 206 24th Ave
- 210 24th Ave
- 1409-1411 NW Central Ave
- 1409- 1411 NW Central Ave
- 66 I St
- 913 N Ocean Ave
- 17 J St
- 1005 N Ocean Ave
- 111 K St Unit C9
- 111 K St Unit A2
Your Personal Tour Guide
Ask me questions while you tour the home.