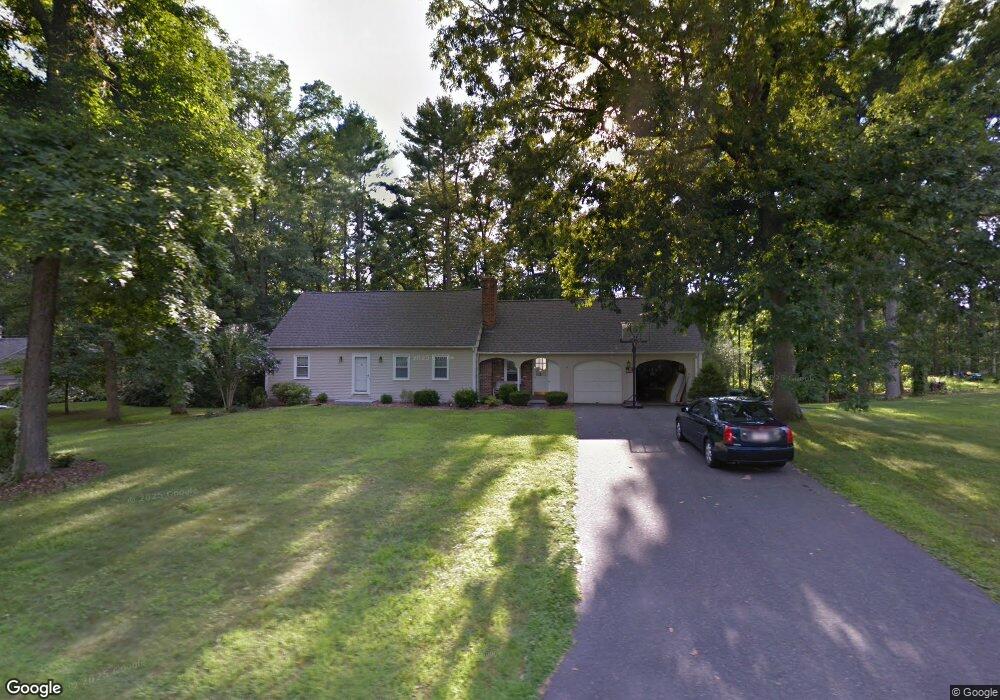
7 Addison Rd Wilbraham, MA 01095
Estimated Value: $496,000 - $565,000
4
Beds
3
Baths
1,802
Sq Ft
$292/Sq Ft
Est. Value
About This Home
This home is located at 7 Addison Rd, Wilbraham, MA 01095 and is currently estimated at $526,726, approximately $292 per square foot. 7 Addison Rd is a home located in Hampden County with nearby schools including Minnechaug Regional High School and Wilbraham & Monson Academy.
Ownership History
Date
Name
Owned For
Owner Type
Purchase Details
Closed on
Jul 2, 2012
Sold by
Franco Thomas
Bought by
Franco Mary T
Current Estimated Value
Purchase Details
Closed on
Jul 31, 1998
Sold by
Brady William P
Bought by
Franco Thomas and Franco Mary T
Home Financials for this Owner
Home Financials are based on the most recent Mortgage that was taken out on this home.
Original Mortgage
$156,750
Interest Rate
6.92%
Mortgage Type
Purchase Money Mortgage
Create a Home Valuation Report for This Property
The Home Valuation Report is an in-depth analysis detailing your home's value as well as a comparison with similar homes in the area
Home Values in the Area
Average Home Value in this Area
Purchase History
| Date | Buyer | Sale Price | Title Company |
|---|---|---|---|
| Franco Mary T | -- | -- | |
| Franco Thomas | $165,000 | -- |
Source: Public Records
Mortgage History
| Date | Status | Borrower | Loan Amount |
|---|---|---|---|
| Previous Owner | Franco Thomas | $156,750 |
Source: Public Records
Tax History Compared to Growth
Tax History
| Year | Tax Paid | Tax Assessment Tax Assessment Total Assessment is a certain percentage of the fair market value that is determined by local assessors to be the total taxable value of land and additions on the property. | Land | Improvement |
|---|---|---|---|---|
| 2025 | $7,978 | $446,200 | $102,000 | $344,200 |
| 2024 | $7,254 | $392,100 | $102,000 | $290,100 |
| 2023 | $6,905 | $368,400 | $102,000 | $266,400 |
| 2022 | $6,905 | $337,000 | $102,000 | $235,000 |
| 2021 | $6,564 | $285,900 | $108,900 | $177,000 |
| 2020 | $6,398 | $285,900 | $108,900 | $177,000 |
| 2019 | $6,235 | $286,000 | $108,900 | $177,100 |
| 2018 | $6,015 | $265,700 | $108,900 | $156,800 |
| 2017 | $5,845 | $265,700 | $108,900 | $156,800 |
| 2016 | $5,661 | $262,100 | $121,200 | $140,900 |
| 2015 | $5,473 | $262,100 | $121,200 | $140,900 |
Source: Public Records
Map
Nearby Homes
- 59 Baldwin Dr
- 374
- 390 Soule Rd
- 19 Forest Hill Rd
- 6 Katie St
- 460 Soule Rd
- 1028 Tinkham Rd
- 230V Burleigh Rd
- 5 Old Carriage Dr
- 85 Brookhaven Dr
- 98 Brookhaven Dr
- 4 Millbrook Dr
- 226 Allen St
- 27 Eastwood Dr
- 72 Tanglewood Dr
- 25 Angelica Dr
- 331 Grand Valley Rd
- 41 Brookside Dr
- 767 Stony Hill Rd
- 763 Stony Hill Rd