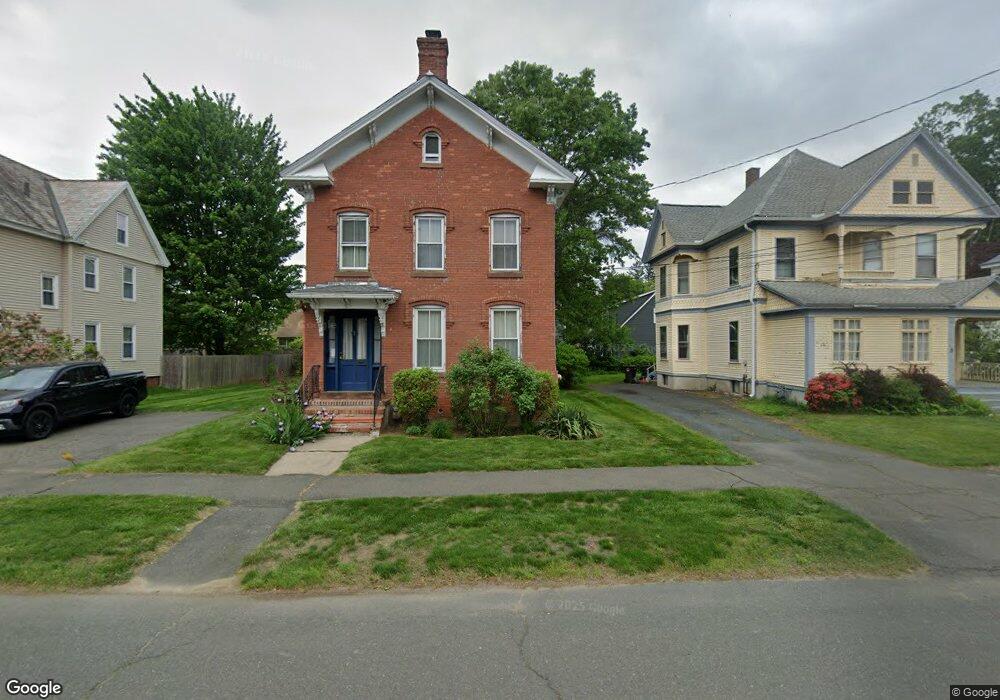
7 Allen Ave Westfield, MA 01085
Estimated Value: $316,000 - $374,000
3
Beds
2
Baths
1,868
Sq Ft
$181/Sq Ft
Est. Value
About This Home
This home is located at 7 Allen Ave, Westfield, MA 01085 and is currently estimated at $338,526, approximately $181 per square foot. 7 Allen Ave is a home located in Hampden County with nearby schools including Westfield High School and Saint Mary High School.
Ownership History
Date
Name
Owned For
Owner Type
Purchase Details
Closed on
Aug 26, 2003
Sold by
Furlani Donald A
Bought by
Fiene Mark A
Current Estimated Value
Home Financials for this Owner
Home Financials are based on the most recent Mortgage that was taken out on this home.
Original Mortgage
$150,960
Outstanding Balance
$66,545
Interest Rate
5.52%
Mortgage Type
VA
Estimated Equity
$271,981
Purchase Details
Closed on
Nov 26, 1997
Sold by
Thayer Howard R and Thayer Constance K
Bought by
Furlani Donald A
Home Financials for this Owner
Home Financials are based on the most recent Mortgage that was taken out on this home.
Original Mortgage
$85,000
Interest Rate
7.26%
Mortgage Type
Purchase Money Mortgage
Create a Home Valuation Report for This Property
The Home Valuation Report is an in-depth analysis detailing your home's value as well as a comparison with similar homes in the area
Home Values in the Area
Average Home Value in this Area
Purchase History
| Date | Buyer | Sale Price | Title Company |
|---|---|---|---|
| Fiene Mark A | $148,000 | -- | |
| Furlani Donald A | $95,000 | -- |
Source: Public Records
Mortgage History
| Date | Status | Borrower | Loan Amount |
|---|---|---|---|
| Open | Fiene Mark A | $150,960 | |
| Previous Owner | Furlani Donald A | $22,300 | |
| Previous Owner | Furlani Donald A | $85,000 |
Source: Public Records
Tax History Compared to Growth
Tax History
| Year | Tax Paid | Tax Assessment Tax Assessment Total Assessment is a certain percentage of the fair market value that is determined by local assessors to be the total taxable value of land and additions on the property. | Land | Improvement |
|---|---|---|---|---|
| 2025 | $4,000 | $263,500 | $96,000 | $167,500 |
| 2024 | $3,945 | $247,000 | $87,400 | $159,600 |
| 2023 | $3,825 | $224,000 | $83,200 | $140,800 |
| 2022 | $3,737 | $202,100 | $74,300 | $127,800 |
| 2021 | $3,333 | $191,500 | $70,000 | $121,500 |
| 2020 | $3,226 | $182,100 | $70,000 | $112,100 |
| 2019 | $3,133 | $174,100 | $66,800 | $107,300 |
| 2018 | $3,067 | $158,400 | $66,800 | $91,600 |
| 2017 | $2,442 | $156,200 | $67,700 | $88,500 |
| 2016 | $3,037 | $156,200 | $67,700 | $88,500 |
| 2015 | $2,896 | $156,200 | $67,700 | $88,500 |
| 2014 | $2,163 | $156,200 | $67,700 | $88,500 |
Source: Public Records
Map
Nearby Homes