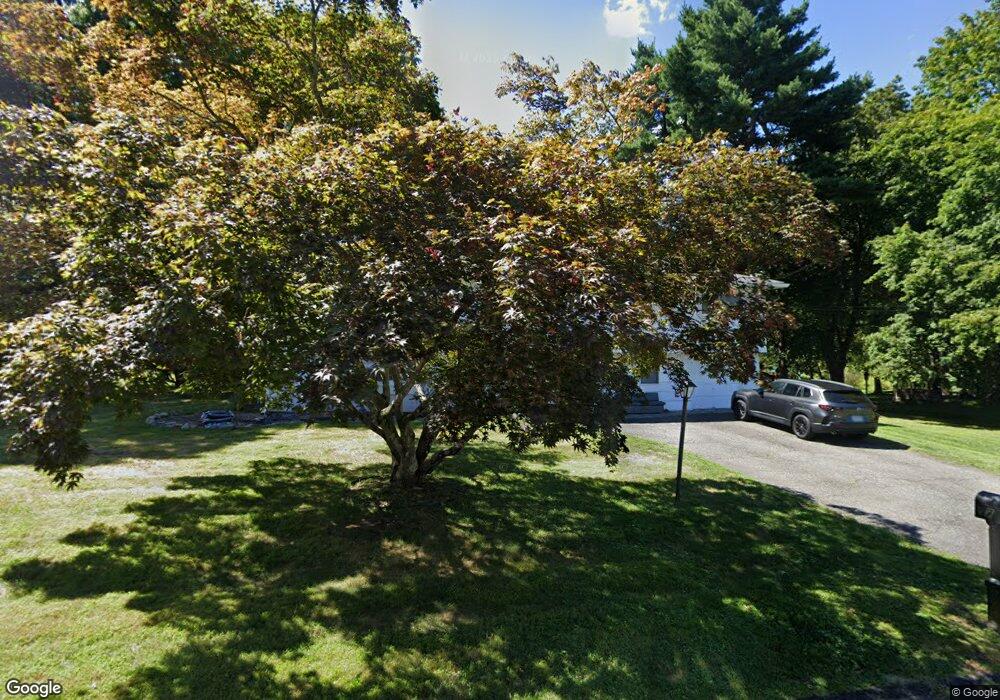
7 Anchor Rd Spring Valley, NY 10977
Estimated Value: $879,140 - $1,081,000
3
Beds
3
Baths
2,546
Sq Ft
$401/Sq Ft
Est. Value
About This Home
This home is located at 7 Anchor Rd, Spring Valley, NY 10977 and is currently estimated at $1,020,035, approximately $400 per square foot. 7 Anchor Rd is a home located in Rockland County with nearby schools including Hempstead Elementary School, Pomona Middle School, and Ramapo High School.
Ownership History
Date
Name
Owned For
Owner Type
Purchase Details
Closed on
Oct 14, 1997
Sold by
Manis Bernice and Patnick Bernice
Bought by
Stochel Daniel E and Stochel Sheri E
Current Estimated Value
Home Financials for this Owner
Home Financials are based on the most recent Mortgage that was taken out on this home.
Original Mortgage
$161,120
Outstanding Balance
$25,954
Interest Rate
7.48%
Mortgage Type
Construction
Estimated Equity
$994,081
Create a Home Valuation Report for This Property
The Home Valuation Report is an in-depth analysis detailing your home's value as well as a comparison with similar homes in the area
Home Values in the Area
Average Home Value in this Area
Purchase History
| Date | Buyer | Sale Price | Title Company |
|---|---|---|---|
| Stochel Daniel E | $201,400 | -- |
Source: Public Records
Mortgage History
| Date | Status | Borrower | Loan Amount |
|---|---|---|---|
| Open | Stochel Daniel E | $161,120 |
Source: Public Records
Tax History
| Year | Tax Paid | Tax Assessment Tax Assessment Total Assessment is a certain percentage of the fair market value that is determined by local assessors to be the total taxable value of land and additions on the property. | Land | Improvement |
|---|---|---|---|---|
| 2024 | $14,116 | $59,700 | $18,200 | $41,500 |
| 2023 | $14,116 | $59,700 | $18,200 | $41,500 |
| 2022 | $13,014 | $59,700 | $18,200 | $41,500 |
| 2021 | $13,013 | $59,700 | $18,200 | $41,500 |
| 2020 | $12,736 | $59,700 | $18,200 | $41,500 |
| 2019 | $13,026 | $59,700 | $18,200 | $41,500 |
| 2018 | $13,026 | $59,700 | $18,200 | $41,500 |
| 2017 | $19,586 | $59,700 | $18,200 | $41,500 |
| 2016 | $12,568 | $59,700 | $18,200 | $41,500 |
| 2015 | -- | $59,700 | $18,200 | $41,500 |
| 2014 | -- | $59,700 | $18,200 | $41,500 |
Source: Public Records
Map
Nearby Homes
- 3 Anchor Rd
- 6 Adele Blvd
- 57 Dessau Cir
- 59 Dessau Cir
- 6 Fairway Oval
- 63 Dessau Cir Unit 52
- 16 Dessau Cir
- 32 Mcnamara Rd
- 44 Greenridge Way
- 11 Rensselaer Dr
- 9 Aron Ct
- 30 Argo Ln
- 5 Schettig Ct
- 6 Pennington Way
- 5 Arcadian Dr
- 158 Summit Park Rd
- 6 Argo Ln
- 619 Union Rd Unit 202
- 161 Mcnamara Rd
- 615 Union Rd Unit 201
Your Personal Tour Guide
Ask me questions while you tour the home.