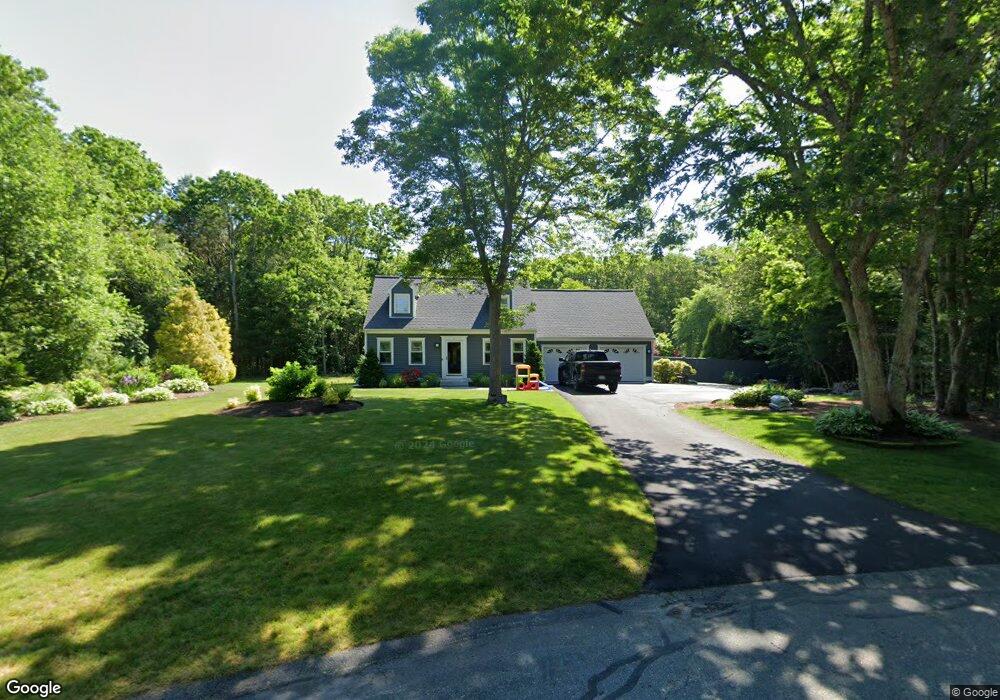
7 Anne Cir Sandwich, MA 02563
Estimated Value: $615,000 - $736,000
3
Beds
2
Baths
1,344
Sq Ft
$498/Sq Ft
Est. Value
About This Home
This home is located at 7 Anne Cir, Sandwich, MA 02563 and is currently estimated at $669,757, approximately $498 per square foot. 7 Anne Cir is a home located in Barnstable County with nearby schools including Sandwich Middle High School, Sandwich Montessori School, and Fair Acres Country Day School.
Ownership History
Date
Name
Owned For
Owner Type
Purchase Details
Closed on
Feb 12, 1997
Sold by
Champion Bldrs Inc
Bought by
Menslage Christopher L and Menslage Kimberly A
Current Estimated Value
Purchase Details
Closed on
Oct 15, 1996
Sold by
Nelson Anne M
Bought by
Champion Bldrs Inc
Create a Home Valuation Report for This Property
The Home Valuation Report is an in-depth analysis detailing your home's value as well as a comparison with similar homes in the area
Home Values in the Area
Average Home Value in this Area
Purchase History
| Date | Buyer | Sale Price | Title Company |
|---|---|---|---|
| Menslage Christopher L | $136,400 | -- | |
| Champion Bldrs Inc | $30,000 | -- |
Source: Public Records
Mortgage History
| Date | Status | Borrower | Loan Amount |
|---|---|---|---|
| Open | Champion Bldrs Inc | $200,000 | |
| Closed | Champion Bldrs Inc | $54,000 | |
| Closed | Champion Bldrs Inc | $50,000 | |
| Closed | Champion Bldrs Inc | $128,000 |
Source: Public Records
Tax History Compared to Growth
Tax History
| Year | Tax Paid | Tax Assessment Tax Assessment Total Assessment is a certain percentage of the fair market value that is determined by local assessors to be the total taxable value of land and additions on the property. | Land | Improvement |
|---|---|---|---|---|
| 2025 | $6,294 | $595,500 | $220,300 | $375,200 |
| 2024 | $6,007 | $556,200 | $196,800 | $359,400 |
| 2023 | $5,822 | $506,300 | $178,900 | $327,400 |
| 2022 | $5,654 | $429,600 | $159,700 | $269,900 |
| 2021 | $5,449 | $395,700 | $153,500 | $242,200 |
| 2020 | $5,471 | $382,300 | $150,000 | $232,300 |
| 2019 | $5,114 | $357,100 | $139,900 | $217,200 |
| 2018 | $4,954 | $346,700 | $142,200 | $204,500 |
| 2017 | $4,905 | $328,500 | $137,600 | $190,900 |
| 2016 | $4,447 | $307,300 | $136,200 | $171,100 |
| 2015 | $4,308 | $290,700 | $122,700 | $168,000 |
Source: Public Records
Map
Nearby Homes
- 3 Anne Cir
- 4 Lan Rd
- 315 Blackthorn Rd
- 159 Cinderella Terrace
- 23 Old Fields Rd
- 7 Open Trail Rd
- 15 Hunters Trail
- 15 Hunters Tr
- 10 Wintergreen Ln
- 65 Bosuns Way
- 3 Glenwood Ln
- 289 Santuit-Newtown Rd
- 5 Aviators Ln
- 7 Highfield Dr
- 19 Oriole Ln
- 59 Southpoint Dr Unit 59
- 58 Southpoint Dr Unit J
- 6 Southfield Ln