Estimated Value: $202,000 - $221,000
3
Beds
2
Baths
1,736
Sq Ft
$122/Sq Ft
Est. Value
About This Home
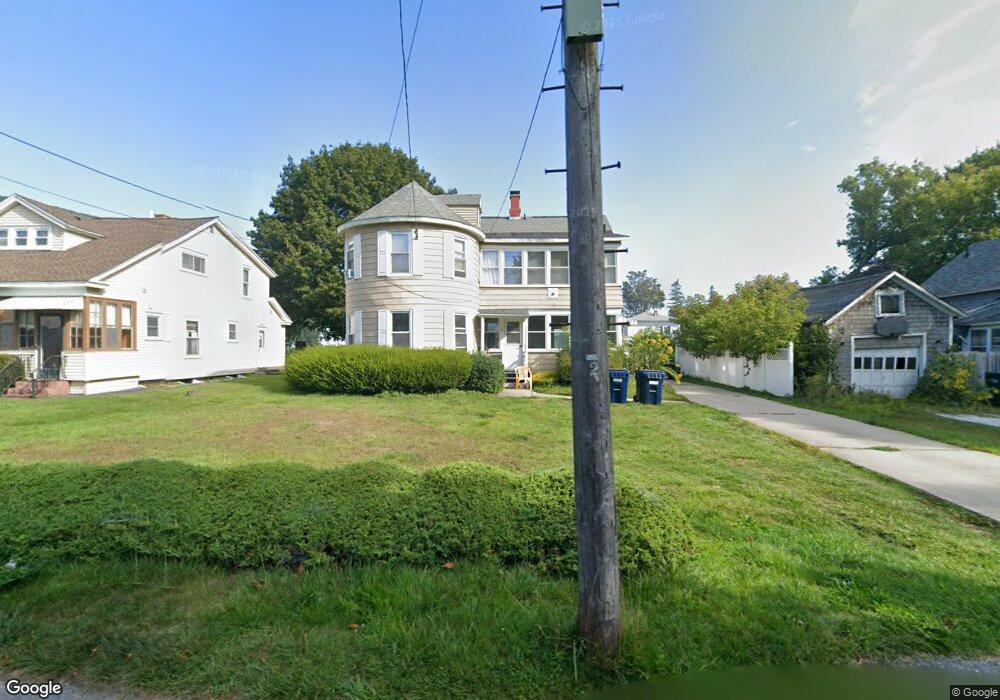
This home is located at 7 Apremont St, Adams, MA 01220 and is currently estimated at $211,630, approximately $121 per square foot. 7 Apremont St is a home located in Berkshire County with nearby schools including Hoosac Valley Middle & High School, Berkshire Arts & Technology Charter Public School, and St. Stanislaus Kostka School.
Ownership History
Date
Name
Owned For
Owner Type
Purchase Details
Closed on
May 5, 2025
Sold by
Bua James A and Bua Jeffrey P
Bought by
Lamberti Amanda
Current Estimated Value
Home Financials for this Owner
Home Financials are based on the most recent Mortgage that was taken out on this home.
Original Mortgage
$205,000
Outstanding Balance
$203,909
Interest Rate
6.67%
Mortgage Type
Purchase Money Mortgage
Estimated Equity
$7,721
Purchase Details
Closed on
Jun 5, 2019
Sold by
Bua James A and Bua Shane A
Bought by
Bua James A and Bua Jeffrey P
Create a Home Valuation Report for This Property
The Home Valuation Report is an in-depth analysis detailing your home's value as well as a comparison with similar homes in the area
Home Values in the Area
Average Home Value in this Area
Purchase History
| Date | Buyer | Sale Price | Title Company |
|---|---|---|---|
| Lamberti Amanda | $200,000 | None Available | |
| Lamberti Amanda | $200,000 | None Available | |
| Bua James A | -- | -- | |
| Bua James A | -- | -- |
Source: Public Records
Mortgage History
| Date | Status | Borrower | Loan Amount |
|---|---|---|---|
| Open | Lamberti Amanda | $205,000 | |
| Closed | Lamberti Amanda | $205,000 |
Source: Public Records
Tax History Compared to Growth
Tax History
| Year | Tax Paid | Tax Assessment Tax Assessment Total Assessment is a certain percentage of the fair market value that is determined by local assessors to be the total taxable value of land and additions on the property. | Land | Improvement |
|---|---|---|---|---|
| 2025 | $2,756 | $162,000 | $44,600 | $117,400 |
| 2024 | $2,599 | $148,200 | $41,800 | $106,400 |
| 2023 | $2,434 | $131,200 | $38,500 | $92,700 |
| 2022 | $2,371 | $113,500 | $33,400 | $80,100 |
| 2021 | $2,497 | $110,400 | $33,400 | $77,000 |
| 2020 | $2,332 | $106,600 | $33,500 | $73,100 |
| 2019 | $2,280 | $106,600 | $33,500 | $73,100 |
| 2018 | $2,339 | $105,300 | $33,500 | $71,800 |
| 2017 | $2,250 | $105,300 | $33,500 | $71,800 |
| 2016 | $2,047 | $95,700 | $33,500 | $62,200 |
| 2015 | $2,015 | $94,300 | $35,200 | $59,100 |
| 2014 | $1,881 | $94,300 | $35,200 | $59,100 |
Source: Public Records
Map
Nearby Homes