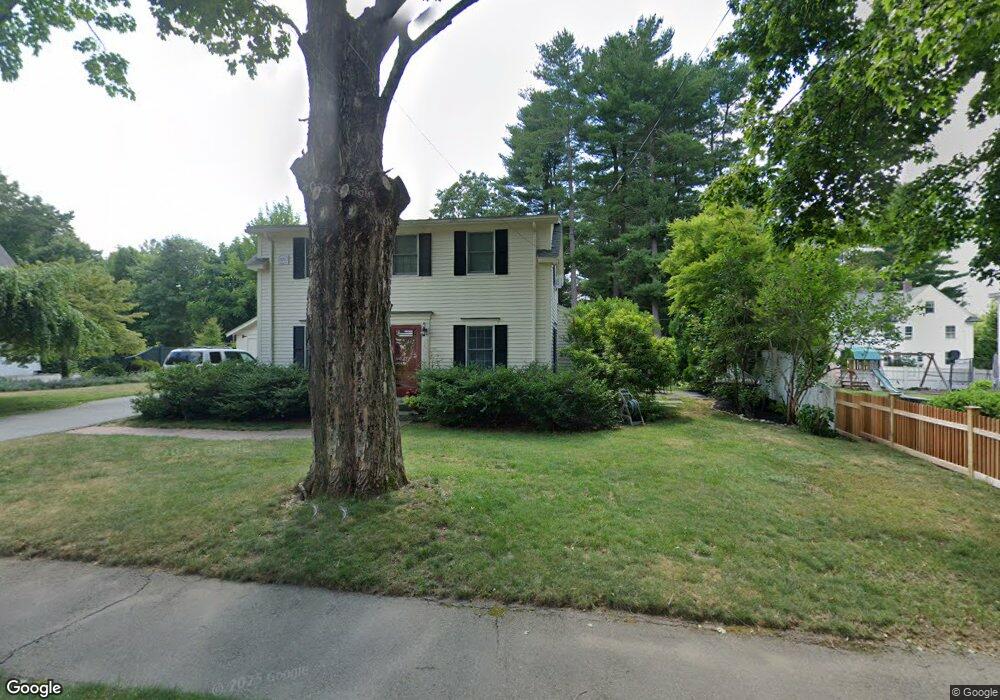
7 Arden Rd Wellesley, MA 02482
Estimated Value: $1,447,932 - $1,934,000
3
Beds
2
Baths
1,932
Sq Ft
$835/Sq Ft
Est. Value
About This Home
This home is located at 7 Arden Rd, Wellesley, MA 02482 and is currently estimated at $1,612,983, approximately $834 per square foot. 7 Arden Rd is a home located in Norfolk County with nearby schools including Hunnewell Elementary School, Wellesley Middle School, and Wellesley Sr High School.
Ownership History
Date
Name
Owned For
Owner Type
Purchase Details
Closed on
Sep 16, 1998
Sold by
Eagan Joseph M
Bought by
Bryant Carleton F and Bryant Susan C
Current Estimated Value
Purchase Details
Closed on
Sep 3, 1993
Sold by
Plimpton Hollis W and Plimpton Constance
Bought by
Eagan Joseph M
Create a Home Valuation Report for This Property
The Home Valuation Report is an in-depth analysis detailing your home's value as well as a comparison with similar homes in the area
Purchase History
| Date | Buyer | Sale Price | Title Company |
|---|---|---|---|
| Bryant Carleton F | $500,000 | -- | |
| Eagan Joseph M | $274,000 | -- |
Source: Public Records
Mortgage History
| Date | Status | Borrower | Loan Amount |
|---|---|---|---|
| Open | Eagan Joseph M | $433,500 | |
| Closed | Eagan Joseph M | $433,500 | |
| Closed | Eagan Joseph M | $445,000 |
Source: Public Records
Tax History
| Year | Tax Paid | Tax Assessment Tax Assessment Total Assessment is a certain percentage of the fair market value that is determined by local assessors to be the total taxable value of land and additions on the property. | Land | Improvement |
|---|---|---|---|---|
| 2025 | $11,565 | $1,125,000 | $989,000 | $136,000 |
| 2024 | $11,680 | $1,122,000 | $989,000 | $133,000 |
| 2023 | $11,107 | $970,000 | $863,000 | $107,000 |
| 2022 | $11,084 | $949,000 | $773,000 | $176,000 |
| 2021 | $10,798 | $919,000 | $743,000 | $176,000 |
| 2020 | $10,624 | $919,000 | $743,000 | $176,000 |
| 2019 | $10,633 | $919,000 | $743,000 | $176,000 |
| 2018 | $11,448 | $958,000 | $856,000 | $102,000 |
| 2017 | $11,295 | $958,000 | $856,000 | $102,000 |
| 2016 | $11,203 | $947,000 | $841,000 | $106,000 |
| 2015 | $10,936 | $946,000 | $841,000 | $105,000 |
Source: Public Records
Map
Nearby Homes
- 20 Arden Rd
- 222 Grove St
- 29 Cottage St
- 333 Cartwright Rd
- 9 Hampden St
- 5 Abbott St
- 121 Livingston Rd
- 63 Linden St Unit 1
- 100 Linden St Unit 111
- 94 Rice St
- 182 Winding River Rd
- 68 Locust Ln
- 148 Weston Rd Unit 208
- 148 Weston Rd Unit 207
- 37 Standish Rd
- 63 Oak St Unit B
- 15 Alden Rd
- 15 Mackintosh Ave
- 33 Avon Rd
- 9 Buttercup Ln