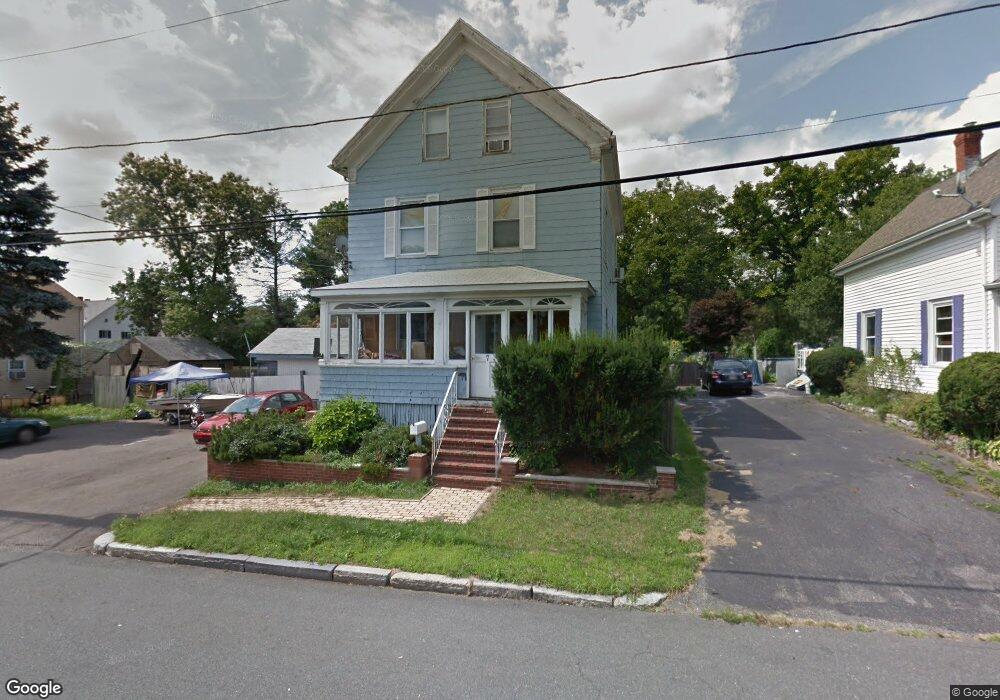
7 Atherton St Saugus, MA 01906
Lynnhurst NeighborhoodEstimated Value: $679,000 - $793,000
3
Beds
2
Baths
1,980
Sq Ft
$365/Sq Ft
Est. Value
About This Home
This home is located at 7 Atherton St, Saugus, MA 01906 and is currently estimated at $722,867, approximately $365 per square foot. 7 Atherton St is a home located in Essex County with nearby schools including Saugus High School and Sacred Heart School.
Ownership History
Date
Name
Owned For
Owner Type
Purchase Details
Closed on
Nov 10, 2000
Sold by
Churches Donald and Churches Gayle
Bought by
Andrews Andrea B
Current Estimated Value
Purchase Details
Closed on
Aug 14, 1989
Sold by
Daggett Bertha
Bought by
Churches Donald
Create a Home Valuation Report for This Property
The Home Valuation Report is an in-depth analysis detailing your home's value as well as a comparison with similar homes in the area
Home Values in the Area
Average Home Value in this Area
Purchase History
| Date | Buyer | Sale Price | Title Company |
|---|---|---|---|
| Andrews Andrea B | $237,000 | -- | |
| Churches Donald | $130,000 | -- | |
| Churches Donald | $130,000 | -- |
Source: Public Records
Mortgage History
| Date | Status | Borrower | Loan Amount |
|---|---|---|---|
| Open | Churches Donald | $277,550 | |
| Closed | Churches Donald | $310,000 |
Source: Public Records
Tax History
| Year | Tax Paid | Tax Assessment Tax Assessment Total Assessment is a certain percentage of the fair market value that is determined by local assessors to be the total taxable value of land and additions on the property. | Land | Improvement |
|---|---|---|---|---|
| 2025 | $7,301 | $683,600 | $315,000 | $368,600 |
| 2024 | $7,024 | $659,500 | $297,000 | $362,500 |
| 2023 | $6,861 | $609,300 | $261,000 | $348,300 |
| 2022 | $6,476 | $539,200 | $239,400 | $299,800 |
| 2021 | $6,180 | $500,800 | $207,900 | $292,900 |
| 2020 | $5,221 | $438,000 | $198,000 | $240,000 |
| 2019 | $4,848 | $398,000 | $180,000 | $218,000 |
| 2018 | $4,398 | $379,800 | $174,600 | $205,200 |
| 2017 | $4,057 | $336,700 | $162,900 | $173,800 |
| 2016 | $3,662 | $300,200 | $162,600 | $137,600 |
| 2015 | $3,440 | $286,200 | $154,900 | $131,300 |
| 2014 | $3,440 | $296,300 | $154,900 | $141,400 |
Source: Public Records
Map
Nearby Homes
- 187 Hamilton St
- 189 Holyoke St
- 4 Oneil Way
- 44 Ballard St
- 0 Hampton St
- 32 Birch Brook Landing Unit 23
- 32 Birch Brook Landing Unit 25
- 32 Birch Brook Landing Unit 22
- 11 Margin St Unit 7
- 79 Laurel St
- 5 Hollis St
- 32 Birch Brook Rd Unit 13
- 32 Birch Brook Rd Unit 27
- 32 Birch Brook Rd Unit 16
- 32 Birch Brook Rd Unit 1
- 32 Birch Brook Rd Unit 14
- 32 Birch Brook Rd Unit 28
- 27 Garfield Ave
- 25 Auburn St
- 36 Jasper St
Your Personal Tour Guide
Ask me questions while you tour the home.