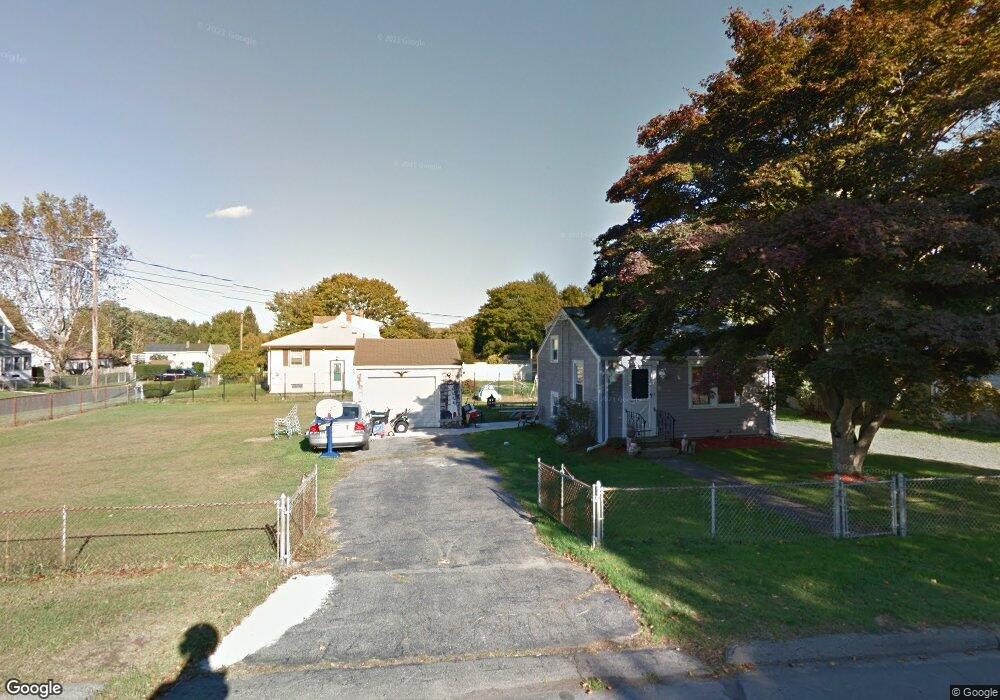
7 Atlas St Fairhaven, MA 02719
Estimated Value: $365,000 - $594,000
1
Bed
1
Bath
849
Sq Ft
$525/Sq Ft
Est. Value
About This Home
This home is located at 7 Atlas St, Fairhaven, MA 02719 and is currently estimated at $446,123, approximately $525 per square foot. 7 Atlas St is a home located in Bristol County with nearby schools including Fairhaven High School, City On A Hill Charter Public School New Bedford, and St. Joseph School.
Ownership History
Date
Name
Owned For
Owner Type
Purchase Details
Closed on
Jan 23, 2009
Sold by
Seddon Gladys
Bought by
Mendez Paul J
Current Estimated Value
Home Financials for this Owner
Home Financials are based on the most recent Mortgage that was taken out on this home.
Original Mortgage
$152,192
Outstanding Balance
$97,881
Interest Rate
5.51%
Mortgage Type
Purchase Money Mortgage
Estimated Equity
$348,242
Purchase Details
Closed on
Apr 11, 2008
Sold by
Seddon Gladys
Bought by
Fauteux Deborah and Seddon Gladys
Create a Home Valuation Report for This Property
The Home Valuation Report is an in-depth analysis detailing your home's value as well as a comparison with similar homes in the area
Home Values in the Area
Average Home Value in this Area
Purchase History
| Date | Buyer | Sale Price | Title Company |
|---|---|---|---|
| Mendez Paul J | $155,000 | -- | |
| Fauteux Deborah | -- | -- |
Source: Public Records
Mortgage History
| Date | Status | Borrower | Loan Amount |
|---|---|---|---|
| Open | Fauteux Deborah | $152,192 |
Source: Public Records
Tax History Compared to Growth
Tax History
| Year | Tax Paid | Tax Assessment Tax Assessment Total Assessment is a certain percentage of the fair market value that is determined by local assessors to be the total taxable value of land and additions on the property. | Land | Improvement |
|---|---|---|---|---|
| 2025 | $25 | $267,700 | $175,400 | $92,300 |
| 2024 | $2,422 | $262,400 | $175,400 | $87,000 |
| 2023 | $2,260 | $227,100 | $153,600 | $73,500 |
| 2022 | $2,180 | $213,300 | $142,800 | $70,500 |
| 2021 | $0 | $185,400 | $129,200 | $56,200 |
| 2020 | $0 | $185,400 | $129,200 | $56,200 |
| 2019 | $1,881 | $161,200 | $107,100 | $54,100 |
| 2018 | $4,729 | $152,300 | $102,000 | $50,300 |
| 2017 | $1,776 | $147,500 | $102,000 | $45,500 |
| 2016 | $1,783 | $146,400 | $102,000 | $44,400 |
| 2015 | $1,733 | $142,600 | $102,000 | $40,600 |
Source: Public Records
Map
Nearby Homes