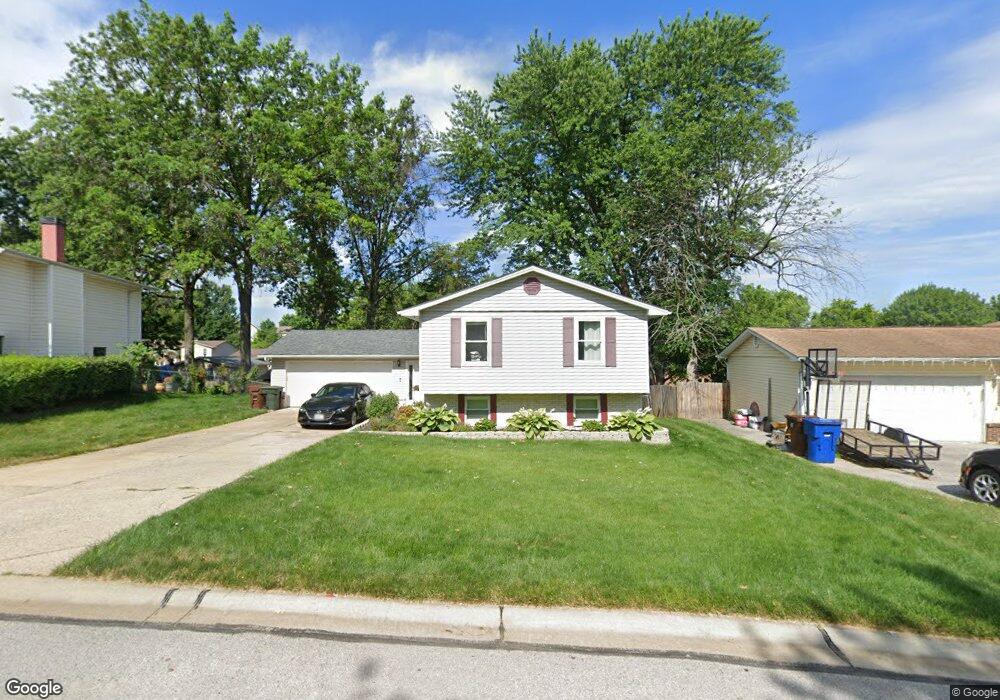
7 Auchly Ln Saint Peters, MO 63376
Estimated Value: $290,000 - $305,000
3
Beds
2
Baths
1,122
Sq Ft
$264/Sq Ft
Est. Value
About This Home
This home is located at 7 Auchly Ln, Saint Peters, MO 63376 and is currently estimated at $296,188, approximately $263 per square foot. 7 Auchly Ln is a home located in St. Charles County with nearby schools including Warren Elementary School, Saeger Middle School, and Francis Howell Central High School.
Ownership History
Date
Name
Owned For
Owner Type
Purchase Details
Closed on
Mar 25, 2016
Sold by
Von Vonjohn and Von Tanya A
Bought by
Von Vonjohn and Von Tanya A
Current Estimated Value
Home Financials for this Owner
Home Financials are based on the most recent Mortgage that was taken out on this home.
Original Mortgage
$28,000
Outstanding Balance
$12,062
Interest Rate
3.62%
Mortgage Type
Second Mortgage Made To Cover Down Payment
Estimated Equity
$284,126
Purchase Details
Closed on
Apr 30, 2003
Sold by
Advantage Properties Llc
Bought by
Von Vonjohn and Von Tonya A
Home Financials for this Owner
Home Financials are based on the most recent Mortgage that was taken out on this home.
Original Mortgage
$116,550
Outstanding Balance
$50,581
Interest Rate
5.77%
Mortgage Type
Purchase Money Mortgage
Estimated Equity
$245,607
Purchase Details
Closed on
Sep 12, 2002
Sold by
Cody Properties Llc
Bought by
Advantage Properties Llc
Purchase Details
Closed on
Sep 11, 2002
Sold by
Brouk Susan Y and National City Mtg Co
Bought by
Cody Properties
Create a Home Valuation Report for This Property
The Home Valuation Report is an in-depth analysis detailing your home's value as well as a comparison with similar homes in the area
Home Values in the Area
Average Home Value in this Area
Purchase History
| Date | Buyer | Sale Price | Title Company |
|---|---|---|---|
| Von Vonjohn | -- | Cardinal Title | |
| Von Vonjohn | $129,500 | -- | |
| Advantage Properties Llc | -- | -- | |
| Cody Properties | $104,900 | -- |
Source: Public Records
Mortgage History
| Date | Status | Borrower | Loan Amount |
|---|---|---|---|
| Open | Von Vonjohn | $28,000 | |
| Open | Von Vonjohn | $116,550 |
Source: Public Records
Tax History Compared to Growth
Tax History
| Year | Tax Paid | Tax Assessment Tax Assessment Total Assessment is a certain percentage of the fair market value that is determined by local assessors to be the total taxable value of land and additions on the property. | Land | Improvement |
|---|---|---|---|---|
| 2025 | $3,072 | $47,102 | -- | -- |
| 2023 | $3,069 | $43,873 | $0 | $0 |
| 2022 | $2,640 | $35,179 | $0 | $0 |
| 2021 | $2,635 | $35,179 | $0 | $0 |
| 2020 | $2,554 | $33,309 | $0 | $0 |
| 2019 | $2,545 | $33,309 | $0 | $0 |
| 2018 | $2,280 | $28,575 | $0 | $0 |
| 2017 | $2,270 | $28,575 | $0 | $0 |
| 2016 | $1,940 | $24,420 | $0 | $0 |
| 2015 | $1,937 | $24,420 | $0 | $0 |
| 2014 | $1,952 | $23,935 | $0 | $0 |
Source: Public Records
Map
Nearby Homes
- 1 Oak Hill Ln
- 1012 Windstream Dr Unit 21
- 116 Willott Square Dr
- 213 Candice Way
- 309 Willott Square Dr
- 525 Ryehill Dr
- 1 Brookmont @ Ryehill Manor
- 50 Oak Hill Ln
- 59 Savannah Hill Dr
- Brookmont Plan at Ryehill Manor
- Parker Plan at Ryehill Manor
- Whitehall Plan at Ryehill Manor
- Lansford Plan at Ryehill Manor
- Stratton Plan at Ryehill Manor
- Winslow Plan at Ryehill Manor
- Carver Plan at Ryehill Manor
- Waverly Plan at Ryehill Manor
- 1 Marianne Dr
- 2175 Orchid Blossom Ct
- 138 Rhythm Point Dr