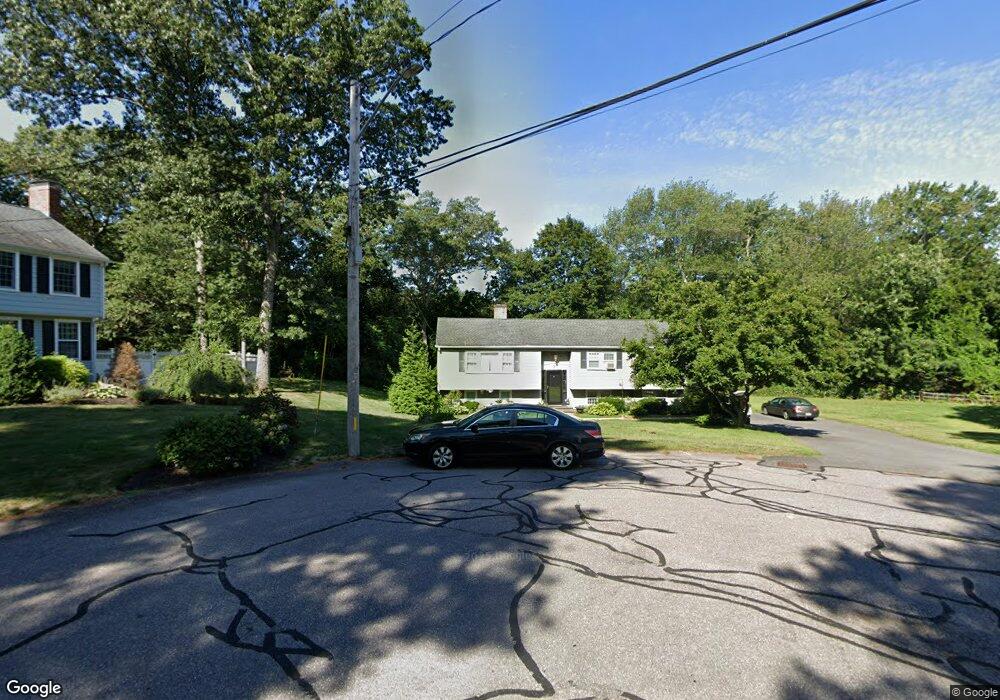
7 Autumn Cir Hingham, MA 02043
Estimated Value: $942,137 - $1,330,000
About This Home
This home is located at 7 Autumn Cir, Hingham, MA 02043 and is currently estimated at $1,097,284, approximately $509 per square foot. 7 Autumn Cir is a home located in Plymouth County with nearby schools including Plymouth River Elementary School, Hingham Middle School, and Hingham High School.
Ownership History
We collect this data history from publicly available records. To have your information removed, we recommend requesting removal directly through your county’s website.
Purchase Details
Purchase Details
Purchase Details
Purchase History
We collect this data history from publicly available records. To have your information removed, we recommend requesting removal directly through your county’s website.
| Date | Buyer | Sale Price | Title Company |
|---|---|---|---|
| -- | -- | ||
| -- | None Available | ||
| $486,000 | -- |
Mortgage History
We collect this data history from publicly available records. To have your information removed, we recommend requesting removal directly through your county’s website.
| Date | Status | Borrower | Loan Amount |
|---|---|---|---|
| Previous Owner | $30,000 | ||
| Previous Owner | $204,000 |
Tax History
We collect this data history from publicly available records. To have your information removed, we recommend requesting removal directly through your county’s website.
| Year | Tax Paid | Tax Assessment Tax Assessment Total Assessment is a certain percentage of the fair market value that is determined by local assessors to be the total taxable value of land and additions on the property. | Land | Improvement |
|---|---|---|---|---|
| 2025 | $7,286 | $681,600 | $415,100 | $266,500 |
| 2024 | $7,089 | $653,400 | $415,100 | $238,300 |
| 2023 | $6,352 | $635,200 | $415,100 | $220,100 |
| 2022 | $6,656 | $575,800 | $358,100 | $217,700 |
| 2021 | $6,530 | $553,400 | $358,100 | $195,300 |
| 2020 | $6,342 | $550,000 | $358,100 | $191,900 |
| 2019 | $6,170 | $522,400 | $358,100 | $164,300 |
| 2018 | $7,807 | $543,100 | $358,100 | $185,000 |
| 2017 | $6,319 | $515,800 | $345,900 | $169,900 |
| 2016 | $6,445 | $516,000 | $329,400 | $186,600 |
| 2015 | $6,597 | $526,500 | $313,700 | $212,800 |
Map
- 10 Autumn Cir
- 17 Berkley Cir
- 21 French St
- 2 Berkley Cir
- 203 High St
- 47 Black Rock Dr
- 14 Black Rock Dr
- 30 Manatee Rd
- 2 Black Rock Dr Unit 21
- 2 Black Rock Dr
- 35 School St
- 1297 Pleasant St
- 1429 Pleasant St
- 5 Blackhorse Ln
- 3 Hollyhock Ln
- 15 Village Rd
- 77 Clinton Rd
- 40 Lake St
- 20 Lake St
- 59 Clubhouse Dr Unit 59
Ask me questions while you tour the home.