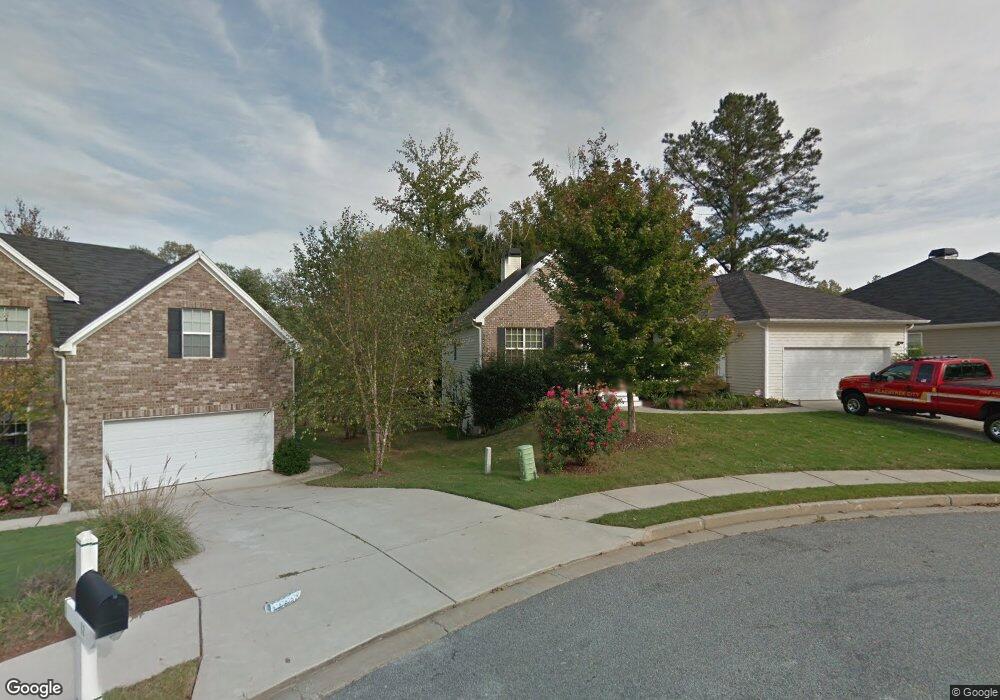
7 Autumn Leaf Newnan, GA 30265
Summergrove NeighborhoodEstimated Value: $559,000 - $606,000
4
Beds
3
Baths
4,130
Sq Ft
$141/Sq Ft
Est. Value
About This Home
This home is located at 7 Autumn Leaf, Newnan, GA 30265 and is currently estimated at $581,550, approximately $140 per square foot. 7 Autumn Leaf is a home located in Coweta County with nearby schools including Newnan Crossing Elementary School, Lee Middle School, and East Coweta High School.
Ownership History
Date
Name
Owned For
Owner Type
Purchase Details
Closed on
Sep 10, 2015
Sold by
Billa Jerry
Bought by
Wallace Frank
Current Estimated Value
Home Financials for this Owner
Home Financials are based on the most recent Mortgage that was taken out on this home.
Original Mortgage
$221,600
Outstanding Balance
$174,408
Interest Rate
3.97%
Mortgage Type
Commercial
Estimated Equity
$407,142
Purchase Details
Closed on
Nov 17, 2010
Sold by
Billa Jerry
Bought by
Billa Jerry and Billa Jeanne M
Home Financials for this Owner
Home Financials are based on the most recent Mortgage that was taken out on this home.
Original Mortgage
$232,000
Interest Rate
4.3%
Mortgage Type
New Conventional
Purchase Details
Closed on
Sep 8, 2004
Sold by
Peachtree City Holdings Llc
Bought by
Weekley Homes
Purchase Details
Closed on
Jan 25, 2000
Bought by
Peachtree City Holdings
Create a Home Valuation Report for This Property
The Home Valuation Report is an in-depth analysis detailing your home's value as well as a comparison with similar homes in the area
Home Values in the Area
Average Home Value in this Area
Purchase History
| Date | Buyer | Sale Price | Title Company |
|---|---|---|---|
| Wallace Frank | $277,000 | -- | |
| Billa Jerry | -- | -- | |
| Weekley Homes | $51,200 | -- | |
| Weekley Homes L P | $51,200 | -- | |
| Peachtree City Holdings | -- | -- |
Source: Public Records
Mortgage History
| Date | Status | Borrower | Loan Amount |
|---|---|---|---|
| Open | Wallace Frank | $221,600 | |
| Closed | Wallace Frank | $27,672 | |
| Previous Owner | Billa Jerry | $232,000 |
Source: Public Records
Tax History Compared to Growth
Tax History
| Year | Tax Paid | Tax Assessment Tax Assessment Total Assessment is a certain percentage of the fair market value that is determined by local assessors to be the total taxable value of land and additions on the property. | Land | Improvement |
|---|---|---|---|---|
| 2024 | $5,140 | $228,355 | $28,000 | $200,355 |
| 2023 | $5,140 | $208,692 | $22,000 | $186,692 |
| 2022 | $4,011 | $168,342 | $22,000 | $146,342 |
| 2021 | $3,660 | $139,734 | $20,000 | $119,734 |
| 2020 | $3,318 | $146,304 | $20,000 | $126,304 |
| 2019 | $3,975 | $136,052 | $16,000 | $120,052 |
| 2018 | $3,998 | $136,052 | $16,000 | $120,052 |
| 2017 | $4,261 | $145,384 | $16,000 | $129,384 |
| 2016 | $3,224 | $126,216 | $16,000 | $110,216 |
| 2015 | $4,096 | $135,800 | $16,000 | $119,800 |
| 2014 | $3,392 | $101,667 | $16,000 | $85,667 |
Source: Public Records
Map
Nearby Homes
- Cabral Plan at Poplar Preserve
- Cali Plan at Poplar Preserve
- Hayden Plan at Poplar Preserve
- Darwin Plan at Poplar Preserve
- Macon Plan at Poplar Preserve
- Galen Plan at Poplar Preserve
- Edmon Plan at Poplar Preserve
- Flora Plan at Poplar Preserve
- Saratoga Plan at Poplar Preserve
- Somerset Plan at Poplar Preserve
- Aria Plan at Poplar Preserve
- 13 Woodbrook Trail
- 9 Woodbrook Trail
- 37 Woodbrook Trail
- 21 Woodbrook Trail
- 17 Woodbrook Trail
- 29 Woodbrook Trail
- 6 Eagle Ct
- 233 Horizon Hill
- 37 Green Spring
- 7 Autumn Loaf
- 11 Autumn Leaf
- 3 Autumn Loaf
- 11 Autumn Loaf
- 0 Autumn Leaf
- 15 Autumn Leaf
- 0 Autumn Loaf
- 15 Autumn Loaf
- 2 Autumn Loaf
- 6 Autumn Loaf
- 145 Horizon Hill
- 14 Autumn Loaf
- 14 Autumn Leaf
- 133 Horizon Hill
- 10 Autumn Loaf
- 10 Autumn Leaf Unit 23
- 10 Autumn Leaf
- 153 Horizon Hill Unit 29
- 153 Horizon Hill
- 129 Horizon Hill