Estimated Value: $1,079,000 - $1,260,000
6
Beds
4
Baths
3,321
Sq Ft
$349/Sq Ft
Est. Value
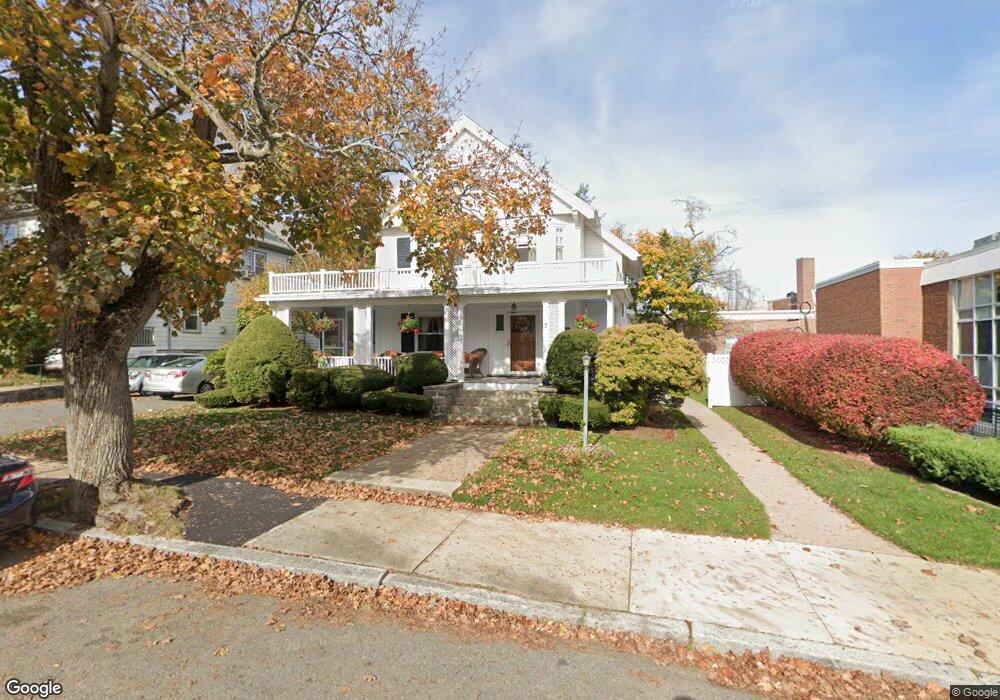
About This Home
This home is located at 7 Avon St, Wakefield, MA 01880 and is currently estimated at $1,159,118, approximately $349 per square foot. 7 Avon St is a home located in Middlesex County with nearby schools including Wakefield Memorial High School, St Joseph School, and Odyssey Day School.
Ownership History
Date
Name
Owned For
Owner Type
Purchase Details
Closed on
Jun 27, 2023
Sold by
Ward Kevin P and Ward Cynthia M
Bought by
Ward
Current Estimated Value
Purchase Details
Closed on
Jun 14, 1978
Bought by
Ward Kevin P and Ward Cynthia M
Create a Home Valuation Report for This Property
The Home Valuation Report is an in-depth analysis detailing your home's value as well as a comparison with similar homes in the area
Home Values in the Area
Average Home Value in this Area
Purchase History
| Date | Buyer | Sale Price | Title Company |
|---|---|---|---|
| Ward | -- | None Available | |
| Ward Kevin P | $54,000 | -- |
Source: Public Records
Mortgage History
| Date | Status | Borrower | Loan Amount |
|---|---|---|---|
| Previous Owner | Ward Kevin P | $76,000 | |
| Previous Owner | Ward Kevin P | $80,000 | |
| Previous Owner | Ward Kevin P | $85,500 |
Source: Public Records
Tax History
| Year | Tax Paid | Tax Assessment Tax Assessment Total Assessment is a certain percentage of the fair market value that is determined by local assessors to be the total taxable value of land and additions on the property. | Land | Improvement |
|---|---|---|---|---|
| 2025 | $11,600 | $1,022,000 | $395,300 | $626,700 |
| 2024 | $11,432 | $1,016,200 | $393,100 | $623,100 |
| 2023 | $10,873 | $926,900 | $358,500 | $568,400 |
| 2022 | $10,401 | $844,200 | $326,500 | $517,700 |
| 2021 | $10,293 | $808,600 | $304,300 | $504,300 |
| 2020 | $9,653 | $755,900 | $284,500 | $471,400 |
| 2019 | $9,221 | $718,700 | $270,500 | $448,200 |
| 2018 | $8,586 | $663,000 | $249,500 | $413,500 |
| 2017 | $8,075 | $619,700 | $233,200 | $386,500 |
| 2016 | $8,178 | $606,200 | $220,600 | $385,600 |
| 2015 | $7,636 | $566,500 | $206,100 | $360,400 |
| 2014 | $6,963 | $544,800 | $198,200 | $346,600 |
Source: Public Records
Map
Nearby Homes
- 43-45 Crescent St
- 50 Tuttle St Unit 12
- 16 Pleasant St
- 62 Foundry St Unit 310
- 62 Foundry St Unit 402
- 62 Foundry St Unit 507
- 62 Foundry St Unit 208
- 62 Foundry St Unit 414
- 62 Foundry St Unit 202
- 62 Foundry St Unit 210
- 10 Wakefield Ave Unit B
- 39 Cedar St
- 35 Richardson St Unit 2
- 9 Cyrus St
- 248 Albion St Unit 231
- 248 Albion St Unit 321
- 1 Traverse St Unit E
- 276 Albion St Unit 10
- 9 2nd St
- 57 Wave Ave
Your Personal Tour Guide
Ask me questions while you tour the home.