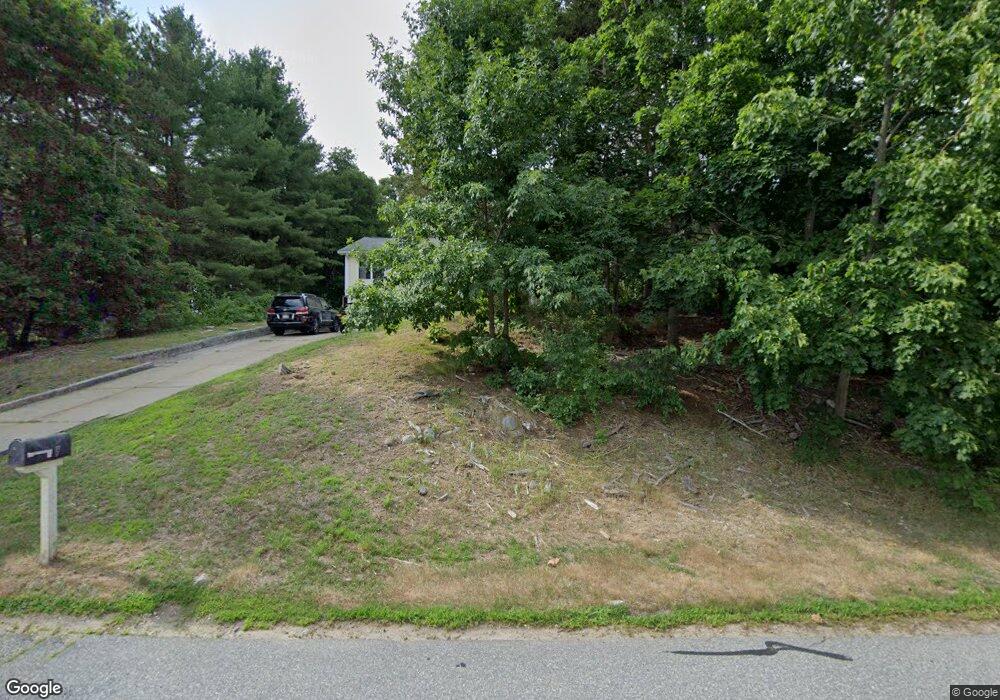
7 Bald Rock Rd Wayland, MA 01778
Estimated Value: $931,000 - $1,026,382
3
Beds
2
Baths
2,160
Sq Ft
$455/Sq Ft
Est. Value
About This Home
This home is located at 7 Bald Rock Rd, Wayland, MA 01778 and is currently estimated at $982,096, approximately $454 per square foot. 7 Bald Rock Rd is a home located in Middlesex County with nearby schools including Wayland High School, Veritas Christian Academy, and The Rivers School.
Ownership History
Date
Name
Owned For
Owner Type
Purchase Details
Closed on
May 15, 2006
Sold by
Izzo Paul
Bought by
Quadir Fariha and Farooqui Nuzhat
Current Estimated Value
Home Financials for this Owner
Home Financials are based on the most recent Mortgage that was taken out on this home.
Original Mortgage
$468,000
Outstanding Balance
$271,046
Interest Rate
6.4%
Mortgage Type
Purchase Money Mortgage
Estimated Equity
$711,050
Purchase Details
Closed on
Jul 28, 2005
Sold by
Harpin Jennifer J
Bought by
Perez Denise and Perez Fernando
Purchase Details
Closed on
Mar 31, 2005
Sold by
Harpin Jennifer J and Izzo Paul
Bought by
Harpin Jennifer J
Purchase Details
Closed on
Dec 31, 1991
Sold by
Howe John B and Howe Susan M
Bought by
Izzo Paul
Purchase Details
Closed on
Apr 3, 1989
Sold by
Mandell John F
Bought by
Howe John B
Create a Home Valuation Report for This Property
The Home Valuation Report is an in-depth analysis detailing your home's value as well as a comparison with similar homes in the area
Home Values in the Area
Average Home Value in this Area
Purchase History
| Date | Buyer | Sale Price | Title Company |
|---|---|---|---|
| Quadir Fariha | $520,000 | -- | |
| Perez Denise | $315,000 | -- | |
| Harpin Jennifer J | -- | -- | |
| Izzo Paul | -- | -- | |
| Quadir Fariha | $520,000 | -- | |
| Perez Denise | $315,000 | -- | |
| Harpin Jennifer J | -- | -- | |
| Izzo Paul | $217,000 | -- | |
| Howe John B | $238,250 | -- |
Source: Public Records
Mortgage History
| Date | Status | Borrower | Loan Amount |
|---|---|---|---|
| Open | Quadir Fariha | $468,000 | |
| Closed | Howe John B | $468,000 | |
| Previous Owner | Howe John B | $75,000 |
Source: Public Records
Tax History Compared to Growth
Tax History
| Year | Tax Paid | Tax Assessment Tax Assessment Total Assessment is a certain percentage of the fair market value that is determined by local assessors to be the total taxable value of land and additions on the property. | Land | Improvement |
|---|---|---|---|---|
| 2025 | $14,156 | $905,700 | $584,000 | $321,700 |
| 2024 | $13,627 | $878,000 | $556,300 | $321,700 |
| 2023 | $13,227 | $794,400 | $505,800 | $288,600 |
| 2022 | $12,500 | $681,200 | $418,800 | $262,400 |
| 2021 | $0 | $639,600 | $380,700 | $258,900 |
| 2020 | $11,421 | $643,100 | $380,700 | $262,400 |
| 2019 | $4,151 | $575,500 | $335,800 | $239,700 |
| 2018 | $0 | $542,500 | $335,800 | $206,700 |
| 2017 | $9,362 | $516,100 | $319,800 | $196,300 |
| 2016 | $9,126 | $526,300 | $313,600 | $212,700 |
| 2015 | $9,480 | $515,500 | $313,600 | $201,900 |
Source: Public Records
Map
Nearby Homes
- 5 Bald Rock Rd
- #5 Bald Rock Rd
- 23 Old Tavern Rd
- 8 Bald Rock Rd
- 10 Bald Rock Rd
- 4 Bald Rock Rd
- 13 Bald Rock Rd
- 10 Snake Brook Rd
- 14 Bald Rock Rd
- 6 Snake Brook Rd
- 18 Snake Brook Rd
- 20 Snake Brook Rd
- 21 Old Tavern Rd
- 12 Snake Brook Rd
- 4 Snake Brook Rd
- 4 Snake Brook Rd
- 27 Old Tavern Rd
- 16 Snake Brook Rd
- 15 Bald Rock Rd
- 31 Old Tavern Rd