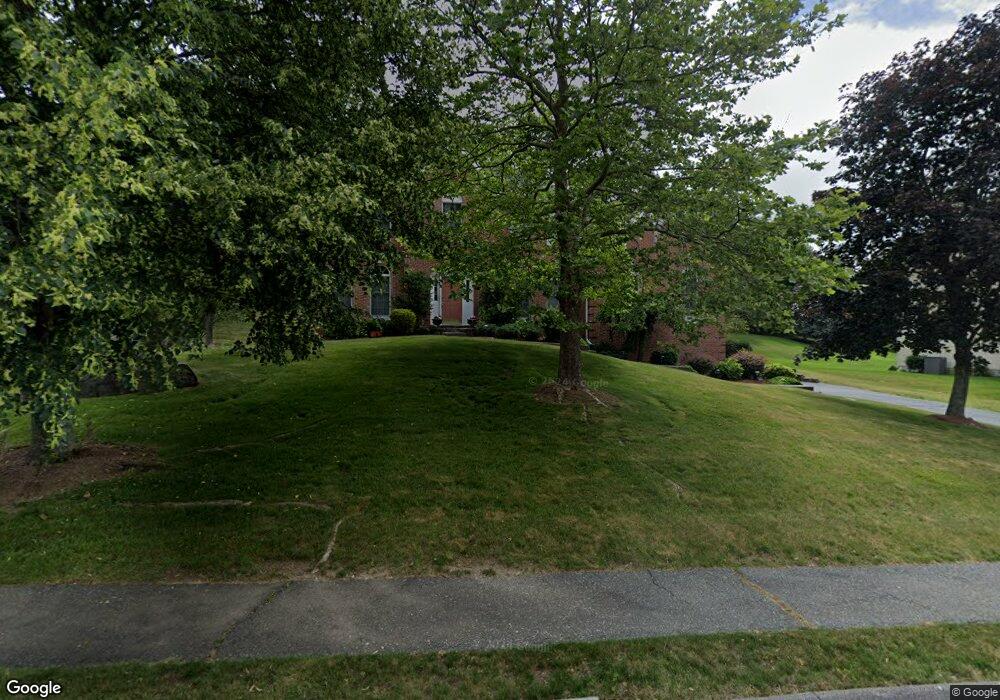
7 Baldwin Cir Shrewsbury, MA 01545
Estimated Value: $1,198,000 - $1,325,000
4
Beds
4
Baths
3,486
Sq Ft
$362/Sq Ft
Est. Value
About This Home
This home is located at 7 Baldwin Cir, Shrewsbury, MA 01545 and is currently estimated at $1,261,787, approximately $361 per square foot. 7 Baldwin Cir is a home located in Worcester County with nearby schools including Sherwood Middle School, Floral Street School, and Oak Middle School.
Ownership History
Date
Name
Owned For
Owner Type
Purchase Details
Closed on
Oct 9, 2023
Sold by
Kaur Raj
Bought by
Raj Kaur Lt and Kaur
Current Estimated Value
Purchase Details
Closed on
Oct 25, 2012
Sold by
Singh Gurdev and Kaur Raj
Bought by
Kaur Raj
Purchase Details
Closed on
Oct 24, 2002
Sold by
Martin Mitchell J and Martin Jane M
Bought by
Singh Gurdev and Kaur Raj
Home Financials for this Owner
Home Financials are based on the most recent Mortgage that was taken out on this home.
Original Mortgage
$300,000
Interest Rate
6.2%
Mortgage Type
Purchase Money Mortgage
Purchase Details
Closed on
Aug 28, 1998
Sold by
Shrewsbury Hunt Lp
Bought by
Martin Mitchell J and Martin Jane M
Create a Home Valuation Report for This Property
The Home Valuation Report is an in-depth analysis detailing your home's value as well as a comparison with similar homes in the area
Home Values in the Area
Average Home Value in this Area
Purchase History
| Date | Buyer | Sale Price | Title Company |
|---|---|---|---|
| Raj Kaur Lt | -- | None Available | |
| Raj Kaur Lt | -- | None Available | |
| Raj Kaur Lt | -- | None Available | |
| Kaur Raj | -- | -- | |
| Kaur Raj | -- | -- | |
| Kaur Raj | -- | -- | |
| Singh Gurdev | $550,000 | -- | |
| Singh Gurdev | $550,000 | -- | |
| Martin Mitchell J | $354,120 | -- | |
| Martin Mitchell J | $354,120 | -- |
Source: Public Records
Mortgage History
| Date | Status | Borrower | Loan Amount |
|---|---|---|---|
| Previous Owner | Martin Mitchell J | $180,000 | |
| Previous Owner | Martin Mitchell J | $300,000 |
Source: Public Records
Tax History Compared to Growth
Tax History
| Year | Tax Paid | Tax Assessment Tax Assessment Total Assessment is a certain percentage of the fair market value that is determined by local assessors to be the total taxable value of land and additions on the property. | Land | Improvement |
|---|---|---|---|---|
| 2025 | $122 | $1,010,300 | $284,300 | $726,000 |
| 2024 | $12,369 | $999,100 | $270,900 | $728,200 |
| 2023 | $11,451 | $872,800 | $270,900 | $601,900 |
| 2022 | $10,666 | $755,900 | $240,800 | $515,100 |
| 2021 | $9,518 | $721,600 | $240,800 | $480,800 |
| 2020 | $8,990 | $720,900 | $240,800 | $480,100 |
| 2019 | $8,681 | $690,600 | $230,500 | $460,100 |
| 2018 | $8,837 | $698,000 | $212,900 | $485,100 |
| 2017 | $8,509 | $663,200 | $192,800 | $470,400 |
| 2016 | $8,467 | $651,300 | $180,900 | $470,400 |
| 2015 | $7,586 | $574,700 | $162,200 | $412,500 |
Source: Public Records
Map
Nearby Homes
- 76 Grove St
- 7 Thoreau Cir
- 6 Meadowsweet Rd
- 495 Grafton St
- 22 Adams Rd
- 468 Grafton St
- 354 Grafton St
- 16 Nelson Point Rd
- 151 Hartford Turnpike Unit 13
- 1 Dorianna Cir
- 1 Purinton St
- 175 Oak St
- 51 Cortland Grove Dr Unit 51
- 40 Adams Farm Rd
- 34 Clews St
- 20 Williamsburg Ct Unit 21
- 190 S Quinsigamond Ave Unit 102
- 26 Williamsburg Ct Unit 22
- 93 Edgemere Blvd Unit 93
- 33 Lakeside Dr
- 5 Baldwin Cir
- 9 Baldwin Cir
- 0 Baldwin Circle Lot C
- 0 Baldwin Circle -Lot E Unit 50379699
- 0 Baldwin Circle L-D Unit 50379698
- 0 Baldwin Circle Lot-B Unit 50379696
- 31 Hawthorne Rd
- 31 Hawthorne Rd
- 29 Hawthorne Rd
- 8 Baldwin Cir
- 8 Baldwin Cir Unit 1
- 6 Baldwin Cir
- 33 Hawthorne Rd
- 3 Baldwin Cir
- 27 Hawthorne Rd
- 4 Baldwin Cir
- 10 Baldwin Cir
- 11 Baldwin Cir
- 35 Hawthorne Rd
- 25 Hawthorne Rd