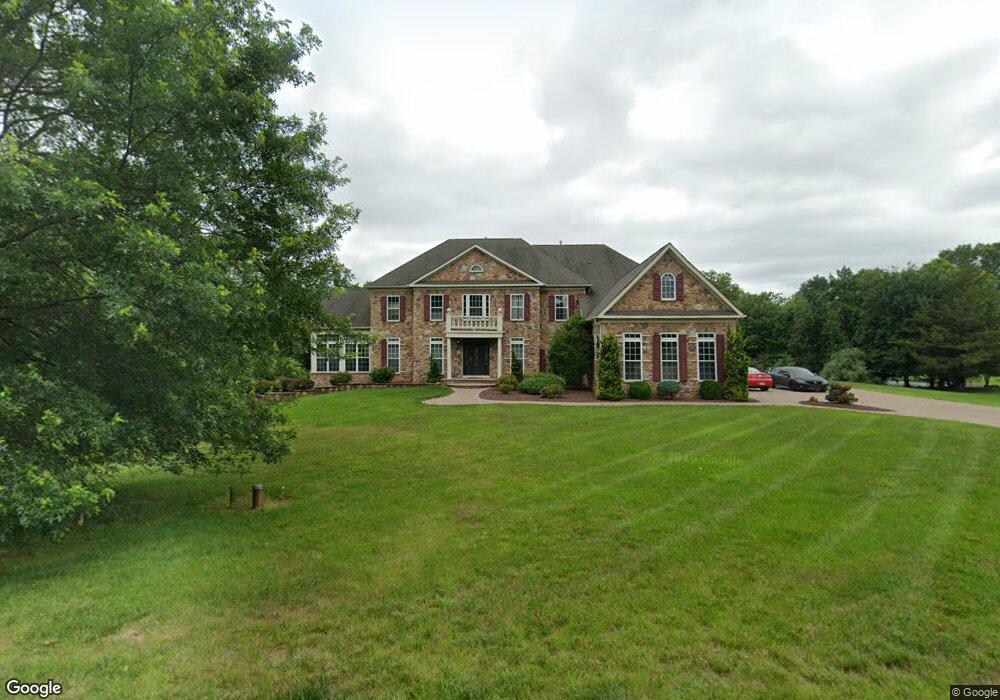
7 Barbieri Ct Princeton, NJ 08540
Estimated Value: $1,067,000 - $1,576,000
4
Beds
5
Baths
4,200
Sq Ft
$335/Sq Ft
Est. Value
About This Home
This home is located at 7 Barbieri Ct, Princeton, NJ 08540 and is currently estimated at $1,405,246, approximately $334 per square foot. 7 Barbieri Ct is a home located in Somerset County with nearby schools including Franklin High School, Guidepost Montessori at Kendall Park, and St. Augustine of Canterbury School.
Ownership History
Date
Name
Owned For
Owner Type
Purchase Details
Closed on
Nov 16, 2009
Sold by
Us Bank National Association
Bought by
Limbachia Kal and Limbachia Anita
Current Estimated Value
Purchase Details
Closed on
Aug 18, 2009
Sold by
Randolph Frederick E
Bought by
Us Bank National Association
Purchase Details
Closed on
Oct 31, 2005
Sold by
Prakashchand Vinodh Kumar
Bought by
Randolph Frederick E
Home Financials for this Owner
Home Financials are based on the most recent Mortgage that was taken out on this home.
Original Mortgage
$704,000
Interest Rate
6.28%
Purchase Details
Closed on
Jun 2, 2005
Sold by
Nvr Inc
Bought by
Prakashchand Vinodh Kumar and Vinodhkumar Rajshree
Home Financials for this Owner
Home Financials are based on the most recent Mortgage that was taken out on this home.
Original Mortgage
$605,000
Interest Rate
5.78%
Mortgage Type
New Conventional
Purchase Details
Closed on
Sep 24, 2004
Sold by
Barbieri Brothers Llc
Bought by
Nvr Inc
Create a Home Valuation Report for This Property
The Home Valuation Report is an in-depth analysis detailing your home's value as well as a comparison with similar homes in the area
Home Values in the Area
Average Home Value in this Area
Purchase History
| Date | Buyer | Sale Price | Title Company |
|---|---|---|---|
| Limbachia Kal | $633,000 | Multiple | |
| Us Bank National Association | $695,000 | None Available | |
| Randolph Frederick E | $1,000,000 | -- | |
| Prakashchand Vinodh Kumar | $879,660 | -- | |
| Prakashchand Vinodh Kumar | $879,660 | None Available | |
| Nvr Inc | $295,000 | -- |
Source: Public Records
Mortgage History
| Date | Status | Borrower | Loan Amount |
|---|---|---|---|
| Previous Owner | Randolph Frederick E | $704,000 | |
| Previous Owner | Prakashchand Vinodh Kumar | $605,000 |
Source: Public Records
Tax History Compared to Growth
Tax History
| Year | Tax Paid | Tax Assessment Tax Assessment Total Assessment is a certain percentage of the fair market value that is determined by local assessors to be the total taxable value of land and additions on the property. | Land | Improvement |
|---|---|---|---|---|
| 2025 | $20,329 | $1,368,000 | $424,600 | $943,400 |
| 2024 | $20,329 | $1,127,500 | $424,600 | $702,900 |
| 2023 | $19,941 | $1,037,500 | $334,600 | $702,900 |
| 2022 | $19,824 | $977,500 | $274,600 | $702,900 |
| 2021 | $20,201 | $915,300 | $212,400 | $702,900 |
| 2020 | $20,677 | $915,300 | $212,400 | $702,900 |
| 2019 | $20,933 | $915,300 | $212,400 | $702,900 |
| 2018 | $21,270 | $920,800 | $212,400 | $708,400 |
| 2017 | $21,353 | $920,800 | $212,400 | $708,400 |
| 2016 | $20,368 | $870,800 | $162,400 | $708,400 |
| 2015 | $20,229 | $870,800 | $162,400 | $708,400 |
| 2014 | $19,924 | $870,800 | $162,400 | $708,400 |
Source: Public Records
Map
Nearby Homes