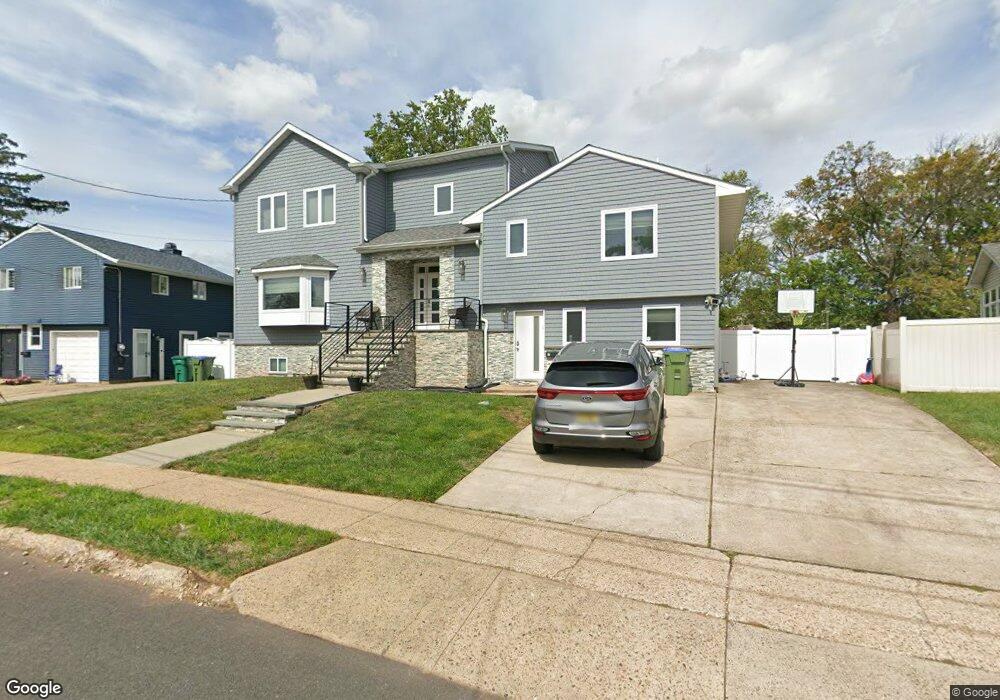
7 Barlow Rd Edison, NJ 08817
Estimated Value: $613,000 - $1,101,000
Studio
--
Bath
2,147
Sq Ft
$419/Sq Ft
Est. Value
About This Home
This home is located at 7 Barlow Rd, Edison, NJ 08817 and is currently estimated at $900,055, approximately $419 per square foot. 7 Barlow Rd is a home located in Middlesex County with nearby schools including John Marshall Elementary School, Thomas Jefferson Middle School, and Edison High School.
Ownership History
Date
Name
Owned For
Owner Type
Purchase Details
Closed on
Jun 15, 2021
Sold by
Schwartz Andrew M and Schwartz Rachel A
Bought by
Gruber Abraham and Matskin Gloria
Current Estimated Value
Home Financials for this Owner
Home Financials are based on the most recent Mortgage that was taken out on this home.
Original Mortgage
$544,000
Outstanding Balance
$492,524
Interest Rate
2.9%
Mortgage Type
New Conventional
Estimated Equity
$407,531
Purchase Details
Closed on
Apr 16, 2019
Sold by
Prasomsuk Nipon
Bought by
Schwartz Andrew M and Schwartz Rachel A
Home Financials for this Owner
Home Financials are based on the most recent Mortgage that was taken out on this home.
Original Mortgage
$280,000
Interest Rate
4.4%
Mortgage Type
New Conventional
Purchase Details
Closed on
Oct 23, 2001
Sold by
Danforth Gloria
Bought by
Prasomsuk Nipon
Home Financials for this Owner
Home Financials are based on the most recent Mortgage that was taken out on this home.
Original Mortgage
$188,250
Interest Rate
6.77%
Mortgage Type
Purchase Money Mortgage
Create a Home Valuation Report for This Property
The Home Valuation Report is an in-depth analysis detailing your home's value as well as a comparison with similar homes in the area
Home Values in the Area
Average Home Value in this Area
Purchase History
| Date | Buyer | Sale Price | Title Company |
|---|---|---|---|
| Gruber Abraham | $680,000 | East Coast Title Agency | |
| Gruber Abraham | $680,000 | Westcor Land Title | |
| Schwartz Andrew M | $350,000 | Foundation Title Llc | |
| Prasomsuk Nipon | $251,000 | -- |
Source: Public Records
Mortgage History
| Date | Status | Borrower | Loan Amount |
|---|---|---|---|
| Open | Gruber Abraham | $544,000 | |
| Closed | Gruber Abraham | $544,000 | |
| Previous Owner | Schwartz Andrew M | $280,000 | |
| Previous Owner | Prasomsuk Nipon | $188,250 |
Source: Public Records
Tax History
| Year | Tax Paid | Tax Assessment Tax Assessment Total Assessment is a certain percentage of the fair market value that is determined by local assessors to be the total taxable value of land and additions on the property. | Land | Improvement |
|---|---|---|---|---|
| 2025 | $18,044 | $303,100 | $100,200 | $202,900 |
| 2024 | $17,947 | $303,100 | $100,200 | $202,900 |
Source: Public Records
Map
Nearby Homes
- 239 Suttons Ln
- 31 Highway Terrace
- 2 Clark Ave
- 20 Clark Ave
- 7 Vale St
- 1711 Central Ave
- 61 Duley Ave
- 271 Central Ave
- 449 Plainfield Ave
- 9 Rolfe Ave
- 111 Barnard St
- 225 Penn Ave
- 27 Sheppard Place
- 223 Plainfield Ave
- 62 Hillcrest Ave
- 65 Orange St
- 47 Hillcrest Ave
- 1947 Raspberry Ct
- 46 Runyon Ave
- 59 Oakland Ave
Your Personal Tour Guide
Ask me questions while you tour the home.