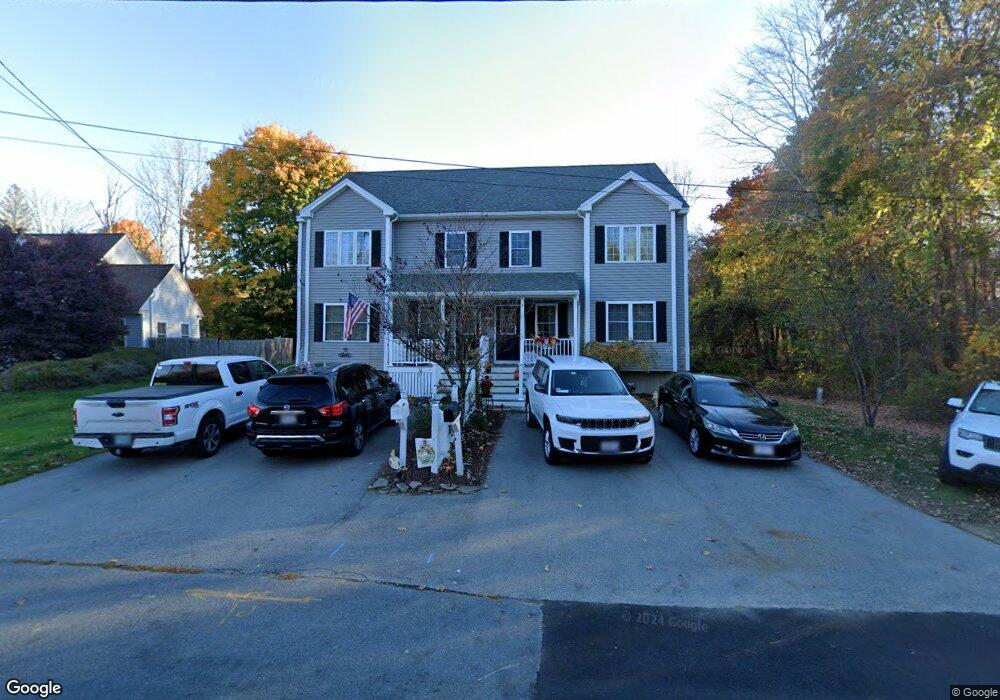
7 Bartlett St Merrimac, MA 01860
Estimated Value: $711,000
6
Beds
2
Baths
3,344
Sq Ft
$213/Sq Ft
Est. Value
About This Home
This home is located at 7 Bartlett St, Merrimac, MA 01860 and is currently priced at $711,000, approximately $212 per square foot. 7 Bartlett St is a home located in Essex County with nearby schools including Pentucket Regional High School.
Ownership History
Date
Name
Owned For
Owner Type
Purchase Details
Closed on
Aug 31, 2023
Sold by
Cormier John J
Bought by
Chase James and Chase Shannon
Current Estimated Value
Home Financials for this Owner
Home Financials are based on the most recent Mortgage that was taken out on this home.
Original Mortgage
$420,481
Outstanding Balance
$411,258
Interest Rate
6.78%
Mortgage Type
FHA
Purchase Details
Closed on
Mar 1, 2011
Sold by
Bc Rt and Cormier
Bought by
Cormier John Joseph
Home Financials for this Owner
Home Financials are based on the most recent Mortgage that was taken out on this home.
Original Mortgage
$350,000
Interest Rate
4%
Mortgage Type
Purchase Money Mortgage
Purchase Details
Closed on
Oct 29, 2009
Sold by
Bella Ft and Grenier
Bought by
Cormier Robert O
Home Financials for this Owner
Home Financials are based on the most recent Mortgage that was taken out on this home.
Original Mortgage
$249,000
Interest Rate
5.06%
Mortgage Type
Purchase Money Mortgage
Purchase Details
Closed on
Aug 21, 2009
Sold by
Bc Rt and Cormier
Bought by
Bella Ft
Create a Home Valuation Report for This Property
The Home Valuation Report is an in-depth analysis detailing your home's value as well as a comparison with similar homes in the area
Home Values in the Area
Average Home Value in this Area
Purchase History
| Date | Buyer | Sale Price | Title Company |
|---|---|---|---|
| Chase James | $435,000 | None Available | |
| Cormier John Joseph | $465,000 | -- | |
| Bc Rt | -- | -- | |
| Cormier Robert O | -- | -- | |
| Bella Ft | $105,000 | -- |
Source: Public Records
Mortgage History
| Date | Status | Borrower | Loan Amount |
|---|---|---|---|
| Open | Chase James | $420,481 | |
| Previous Owner | Bella Ft | $25,000 | |
| Previous Owner | Bc Rt | $350,000 | |
| Previous Owner | Bella Ft | $249,000 |
Source: Public Records
Tax History
| Year | Tax Paid | Tax Assessment Tax Assessment Total Assessment is a certain percentage of the fair market value that is determined by local assessors to be the total taxable value of land and additions on the property. | Land | Improvement |
|---|---|---|---|---|
| 2023 | $9,150 | $619,500 | $232,800 | $386,700 |
| 2022 | $8,851 | $541,700 | $187,600 | $354,100 |
| 2021 | $8,750 | $536,800 | $171,400 | $365,400 |
| 2020 | $7,988 | $536,800 | $171,400 | $365,400 |
| 2019 | $8,033 | $508,100 | $148,800 | $359,300 |
| 2018 | $7,976 | $506,100 | $139,100 | $367,000 |
| 2017 | $7,899 | $483,400 | $116,400 | $367,000 |
| 2016 | $7,812 | $483,400 | $116,400 | $367,000 |
| 2015 | $7,486 | $460,700 | $116,400 | $344,300 |
| 2014 | $7,135 | $449,000 | $116,400 | $332,600 |
Source: Public Records
Map
Nearby Homes
- 7 Bartlett St Unit B
- 7 Bartlett St Unit A
- 5-7 Bartlett St
- 9 Bartlett St
- 19 Bartlett St
- 12 Bartlett St
- 11 Cormier Way Unit 16
- 11 Cormier Way Unit 11
- 8 Bartlett St Unit 8
- 8 Bartlett St
- 8 Bartlett St Unit 10
- 10 Bartlett St Unit 10
- 29 Mill St
- 18 Mill St
- 14 Cormier Way Unit 14
- 6 Bartlett St
- 3 Bartlett St
- 20 Mill St
- 7 Cormier Way Unit 7
- 5 Cormier Way Unit 5
Your Personal Tour Guide
Ask me questions while you tour the home.