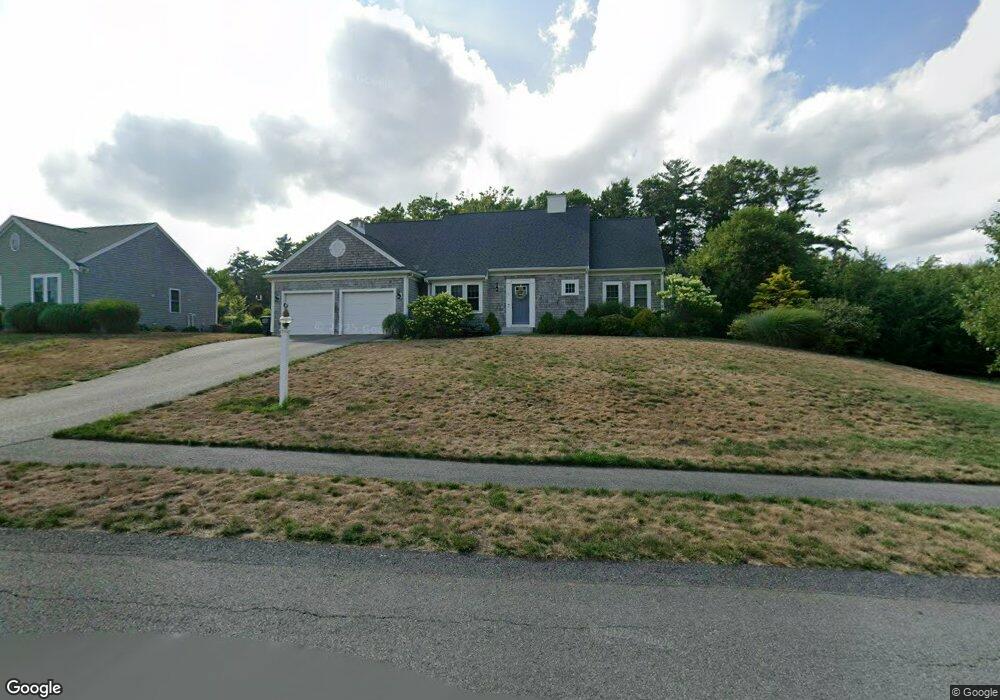
7 Bearses Way Kingston, MA 02364
Estimated Value: $822,000 - $1,034,000
3
Beds
3
Baths
2,737
Sq Ft
$346/Sq Ft
Est. Value
About This Home
This home is located at 7 Bearses Way, Kingston, MA 02364 and is currently estimated at $945,806, approximately $345 per square foot. 7 Bearses Way is a home with nearby schools including Silver Lake Regional High School, Kingston Elementary School, and Kingston Intermediate School.
Ownership History
Date
Name
Owned For
Owner Type
Purchase Details
Closed on
May 14, 2021
Sold by
Linnehan Gregory G and Linnehan Stacy
Bought by
Linnehan Ft
Current Estimated Value
Purchase Details
Closed on
Jun 7, 2016
Sold by
Champion Builders Inc
Bought by
Linnehan Gregory G and Linnehan Stacy
Home Financials for this Owner
Home Financials are based on the most recent Mortgage that was taken out on this home.
Original Mortgage
$463,500
Interest Rate
3.59%
Mortgage Type
New Conventional
Purchase Details
Closed on
Feb 9, 1982
Bought by
Champion Builders Inc
Create a Home Valuation Report for This Property
The Home Valuation Report is an in-depth analysis detailing your home's value as well as a comparison with similar homes in the area
Home Values in the Area
Average Home Value in this Area
Purchase History
| Date | Buyer | Sale Price | Title Company |
|---|---|---|---|
| Linnehan Ft | -- | None Available | |
| Linnehan Gregory G | $515,000 | -- | |
| Champion Builders Inc | -- | -- |
Source: Public Records
Mortgage History
| Date | Status | Borrower | Loan Amount |
|---|---|---|---|
| Previous Owner | Linnehan Gregory G | $463,500 |
Source: Public Records
Tax History
| Year | Tax Paid | Tax Assessment Tax Assessment Total Assessment is a certain percentage of the fair market value that is determined by local assessors to be the total taxable value of land and additions on the property. | Land | Improvement |
|---|---|---|---|---|
| 2025 | $10,734 | $827,600 | $204,700 | $622,900 |
| 2024 | $10,542 | $829,400 | $204,700 | $624,700 |
| 2023 | $9,936 | $743,700 | $204,700 | $539,000 |
| 2022 | $9,952 | $682,600 | $181,500 | $501,100 |
| 2021 | $10,026 | $623,500 | $166,300 | $457,200 |
| 2020 | $9,740 | $598,300 | $166,300 | $432,000 |
| 2019 | $9,269 | $563,100 | $166,300 | $396,800 |
| 2018 | $8,352 | $507,700 | $166,300 | $341,400 |
| 2017 | $8,286 | $502,200 | $181,200 | $321,000 |
| 2016 | $2,212 | $125,600 | $125,600 | $0 |
| 2015 | $508 | $30,000 | $30,000 | $0 |
| 2014 | $500 | $30,000 | $30,000 | $0 |
Source: Public Records
Map
Nearby Homes