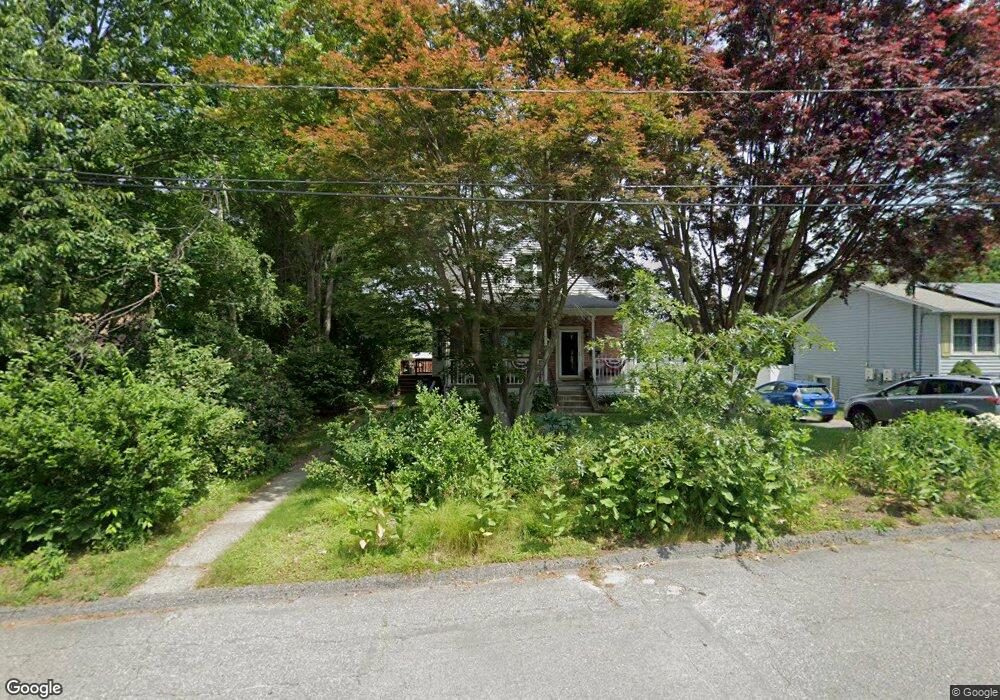
7 Bel Air St Unit 1 Worcester, MA 01609
Salisbury Street NeighborhoodEstimated Value: $436,000 - $483,000
3
Beds
2
Baths
1,800
Sq Ft
$254/Sq Ft
Est. Value
About This Home
This home is located at 7 Bel Air St Unit 1, Worcester, MA 01609 and is currently estimated at $457,125, approximately $253 per square foot. 7 Bel Air St Unit 1 is a home located in Worcester County with nearby schools including Chandler Magnet, Jacob Hiatt Magnet School, and Flagg Street School.
Ownership History
Date
Name
Owned For
Owner Type
Purchase Details
Closed on
May 18, 2018
Sold by
Beauregard Christopher S and Beauregard Dawn-Marie M
Bought by
Linden-Hale Nancy and Adams-Armsby Elinor
Current Estimated Value
Home Financials for this Owner
Home Financials are based on the most recent Mortgage that was taken out on this home.
Original Mortgage
$200,000
Outstanding Balance
$170,587
Interest Rate
4%
Mortgage Type
New Conventional
Estimated Equity
$286,538
Purchase Details
Closed on
Jun 30, 2000
Sold by
Avedian Andrwe R and Vaedian Victoria D
Bought by
Beauregard Christopher and Messina Dawn Marie
Purchase Details
Closed on
Jan 28, 1994
Sold by
Ford Consumer Finance
Bought by
Avedian Andrew and Avedian Victoria
Purchase Details
Closed on
Jun 16, 1989
Sold by
Husson Michael
Bought by
Daigneault Richard
Create a Home Valuation Report for This Property
The Home Valuation Report is an in-depth analysis detailing your home's value as well as a comparison with similar homes in the area
Home Values in the Area
Average Home Value in this Area
Purchase History
| Date | Buyer | Sale Price | Title Company |
|---|---|---|---|
| Linden-Hale Nancy | $250,250 | -- | |
| Beauregard Christopher | $150,000 | -- | |
| Avedian Andrew | $102,500 | -- | |
| Ford Consumer Finance | $89,350 | -- | |
| Daigneault Richard | $45,000 | -- |
Source: Public Records
Mortgage History
| Date | Status | Borrower | Loan Amount |
|---|---|---|---|
| Open | Linden-Hale Nancy | $200,000 | |
| Previous Owner | Daigneault Richard | $25,000 | |
| Previous Owner | Daigneault Richard | $142,000 |
Source: Public Records
Tax History Compared to Growth
Tax History
| Year | Tax Paid | Tax Assessment Tax Assessment Total Assessment is a certain percentage of the fair market value that is determined by local assessors to be the total taxable value of land and additions on the property. | Land | Improvement |
|---|---|---|---|---|
| 2025 | $4,850 | $367,700 | $119,000 | $248,700 |
| 2024 | $4,660 | $338,900 | $119,000 | $219,900 |
| 2023 | $4,465 | $311,400 | $103,400 | $208,000 |
| 2022 | $4,104 | $269,800 | $82,800 | $187,000 |
| 2021 | $3,971 | $243,900 | $66,200 | $177,700 |
| 2020 | $3,791 | $223,000 | $66,200 | $156,800 |
| 2019 | $3,645 | $202,500 | $59,700 | $142,800 |
| 2018 | $3,638 | $192,400 | $59,700 | $132,700 |
| 2017 | $3,490 | $181,600 | $59,700 | $121,900 |
| 2016 | $3,450 | $167,400 | $44,400 | $123,000 |
| 2015 | $3,360 | $167,400 | $44,400 | $123,000 |
| 2014 | $3,271 | $167,400 | $44,400 | $123,000 |
Source: Public Records
Map
Nearby Homes
- 33 Aylesbury Rd
- 5 Forest Hill Dr
- 12 Merlin Ct
- 32 Aylesbury Rd
- 40 Rustic Dr
- 22 Audubon Rd
- 7 Old Brook Dr
- 134 Richmond Ave
- 1029 Pleasant St Unit 19
- 2 Baiting Brook Ln Unit 71
- 9 Dennison Rd
- 980 Pleasant St
- 3 Old English Rd
- 57 Berwick St
- 3 Carter Way
- 617 Salisbury St
- 477 Salisbury St
- 66 Brigham Rd
- 12 Copperfield Rd
- 31 Lenox St