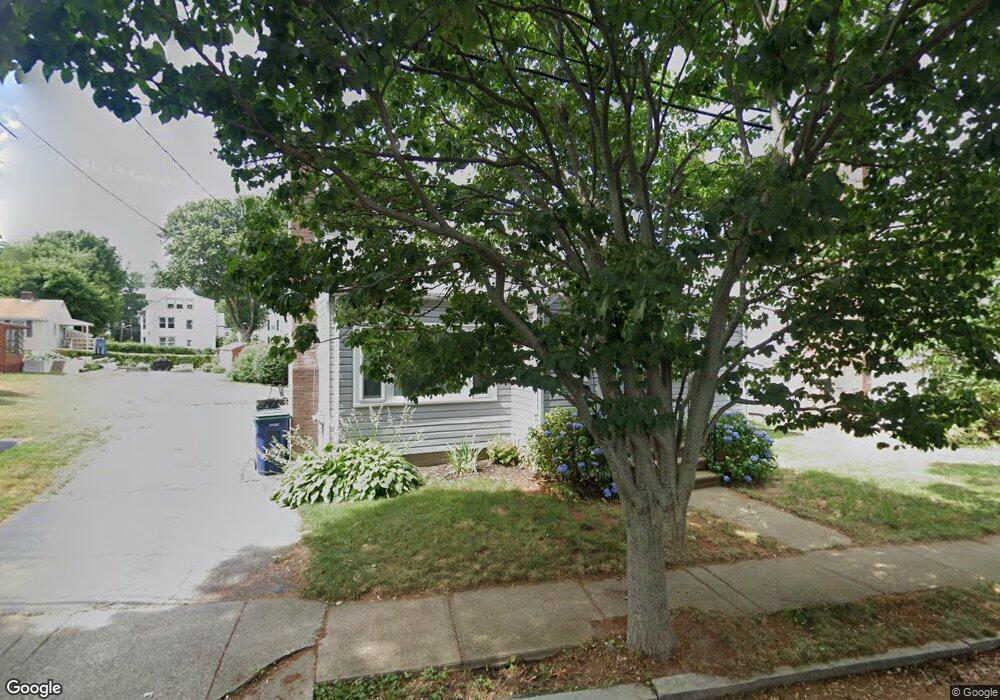
7 Belleau Rd Salem, MA 01970
South Salem NeighborhoodEstimated Value: $658,049 - $766,000
4
Beds
2
Baths
1,595
Sq Ft
$445/Sq Ft
Est. Value
About This Home
This home is located at 7 Belleau Rd, Salem, MA 01970 and is currently estimated at $710,262, approximately $445 per square foot. 7 Belleau Rd is a home located in Essex County with nearby schools including Saltonstall School, Horace Mann Laboratory, and Carlton Elementary School.
Ownership History
Date
Name
Owned For
Owner Type
Purchase Details
Closed on
May 24, 2019
Sold by
Tucker Daniel P
Bought by
Tucker Katelyn M
Current Estimated Value
Home Financials for this Owner
Home Financials are based on the most recent Mortgage that was taken out on this home.
Original Mortgage
$263,564
Outstanding Balance
$231,726
Interest Rate
4.2%
Mortgage Type
FHA
Estimated Equity
$478,536
Purchase Details
Closed on
Nov 28, 2011
Sold by
Dufour Philip J and Nadeau Claire M
Bought by
Tucker Daniel P
Home Financials for this Owner
Home Financials are based on the most recent Mortgage that was taken out on this home.
Original Mortgage
$252,863
Interest Rate
4.12%
Mortgage Type
Purchase Money Mortgage
Create a Home Valuation Report for This Property
The Home Valuation Report is an in-depth analysis detailing your home's value as well as a comparison with similar homes in the area
Home Values in the Area
Average Home Value in this Area
Purchase History
| Date | Buyer | Sale Price | Title Company |
|---|---|---|---|
| Tucker Katelyn M | -- | -- | |
| Tucker Daniel P | $264,000 | -- |
Source: Public Records
Mortgage History
| Date | Status | Borrower | Loan Amount |
|---|---|---|---|
| Open | Tucker Katelyn M | $263,564 | |
| Previous Owner | Tucker Daniel P | $252,863 |
Source: Public Records
Tax History Compared to Growth
Tax History
| Year | Tax Paid | Tax Assessment Tax Assessment Total Assessment is a certain percentage of the fair market value that is determined by local assessors to be the total taxable value of land and additions on the property. | Land | Improvement |
|---|---|---|---|---|
| 2025 | $5,895 | $519,800 | $210,900 | $308,900 |
| 2024 | $5,770 | $496,600 | $200,500 | $296,100 |
| 2023 | $5,532 | $442,200 | $185,000 | $257,200 |
| 2022 | $5,525 | $417,000 | $178,900 | $238,100 |
| 2021 | $5,165 | $374,300 | $166,500 | $207,800 |
| 2020 | $5,182 | $358,600 | $157,300 | $201,300 |
| 2019 | $5,155 | $341,400 | $149,300 | $192,100 |
| 2018 | $4,934 | $320,800 | $141,900 | $178,900 |
| 2017 | $4,590 | $289,400 | $119,700 | $169,700 |
| 2016 | $4,447 | $283,800 | $114,100 | $169,700 |
| 2015 | $4,321 | $263,300 | $104,900 | $158,400 |
Source: Public Records
Map
Nearby Homes
- 327 Lafayette St Unit 2
- 17 Cliff St
- 24 Wisteria St Unit 2
- 4 Willow Ave Unit 2
- 14 Meadow St
- 9 Glover St Unit 1
- 10 Hazel St Unit 2
- 2A Hazel St Unit 3
- 11 Sumner Rd
- 263 Jefferson Ave
- 16 Leavitt St Unit 2
- 7 Fairfield St
- 9 Lyme St
- 1 Laurent Rd Unit 3
- 10 Quadrant Rd
- 10 Horton St
- 23 Marion Rd Unit B
- 29 Willson St
- 32 Park St
- 25 Perkins St