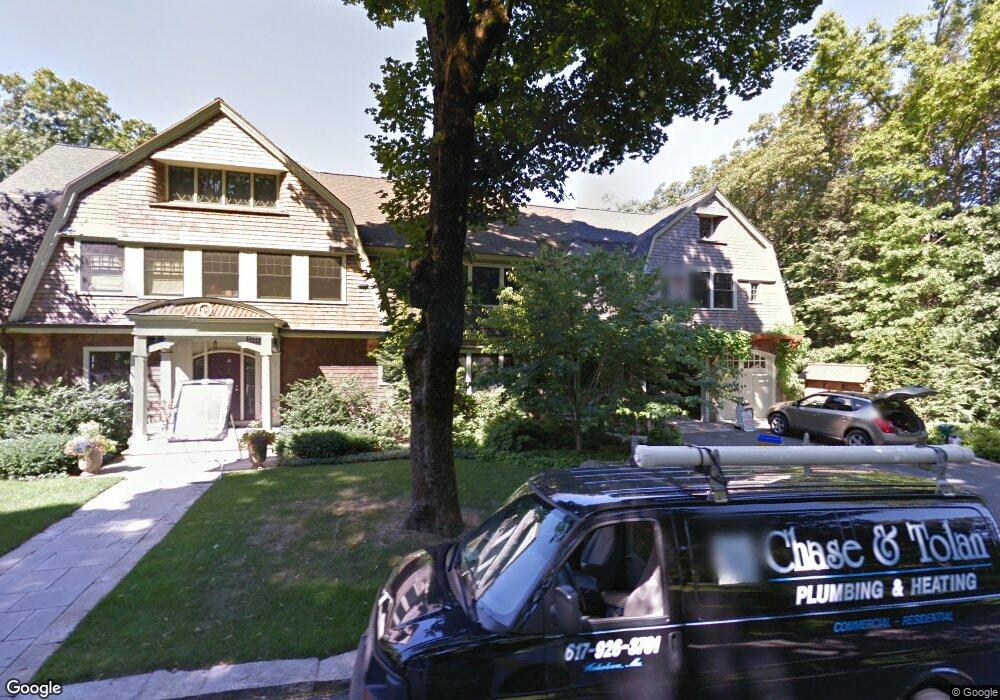
7 Bennington Rd Lexington, MA 02421
Munroe Hill NeighborhoodEstimated Value: $4,313,000 - $5,423,000
5
Beds
5
Baths
6,615
Sq Ft
$738/Sq Ft
Est. Value
About This Home
This home is located at 7 Bennington Rd, Lexington, MA 02421 and is currently estimated at $4,884,203, approximately $738 per square foot. 7 Bennington Rd is a home located in Middlesex County with nearby schools including Bowman Elementary School, Jonas Clarke Middle School, and Lexington High School.
Ownership History
Date
Name
Owned For
Owner Type
Purchase Details
Closed on
Oct 19, 2021
Sold by
Krupka Michael A and Kubik Anne C
Bought by
Kubik Anne C
Current Estimated Value
Purchase Details
Closed on
Sep 23, 2004
Sold by
7 Bennington Road Nt
Bought by
Kubik Anne C and Krupka Michael Alan
Purchase Details
Closed on
May 6, 2004
Sold by
Moloney Gerard T and Moloney Mary Ellen C
Bought by
7 Bennington Road Nt
Purchase Details
Closed on
Jun 27, 2002
Sold by
Verdine Gregory L and Verdine Kasumi
Bought by
Moloney Gerard T and Moloney Maryellen
Home Financials for this Owner
Home Financials are based on the most recent Mortgage that was taken out on this home.
Original Mortgage
$1,500,000
Interest Rate
6.92%
Mortgage Type
Purchase Money Mortgage
Purchase Details
Closed on
Aug 21, 1998
Sold by
Neuman W Russell W and Neuman Susan B
Bought by
Verdine Gregory L and Verdine Kasumi
Create a Home Valuation Report for This Property
The Home Valuation Report is an in-depth analysis detailing your home's value as well as a comparison with similar homes in the area
Home Values in the Area
Average Home Value in this Area
Purchase History
| Date | Buyer | Sale Price | Title Company |
|---|---|---|---|
| Kubik Anne C | -- | None Available | |
| Kubik Anne C | -- | None Available | |
| Kubik Anne C | -- | -- | |
| 7 Bennington Road Nt | $4,700,000 | -- | |
| Moloney Gerard T | $2,050,000 | -- | |
| Kubik Anne C | -- | -- | |
| 7 Bennington Road Nt | $4,700,000 | -- | |
| Moloney Gerard T | $2,050,000 | -- | |
| Verdine Gregory L | $1,115,000 | -- |
Source: Public Records
Mortgage History
| Date | Status | Borrower | Loan Amount |
|---|---|---|---|
| Previous Owner | Moloney Gerard T | $1,500,000 | |
| Previous Owner | Verdine Gregory L | $500,000 | |
| Previous Owner | Verdine Gregory L | $300,000 |
Source: Public Records
Tax History
| Year | Tax Paid | Tax Assessment Tax Assessment Total Assessment is a certain percentage of the fair market value that is determined by local assessors to be the total taxable value of land and additions on the property. | Land | Improvement |
|---|---|---|---|---|
| 2025 | $46,278 | $3,784,000 | $1,195,000 | $2,589,000 |
| 2024 | $72,251 | $5,898,000 | $1,138,000 | $4,760,000 |
| 2023 | $66,053 | $5,081,000 | $1,039,000 | $4,042,000 |
| 2022 | $66,392 | $4,811,000 | $948,000 | $3,863,000 |
| 2021 | $62,683 | $4,356,000 | $905,000 | $3,451,000 |
| 2020 | $63,211 | $4,499,000 | $905,000 | $3,594,000 |
| 2019 | $60,674 | $4,297,000 | $864,000 | $3,433,000 |
| 2018 | $59,602 | $4,168,000 | $801,000 | $3,367,000 |
| 2017 | $58,945 | $4,068,000 | $763,000 | $3,305,000 |
| 2016 | $59,305 | $4,062,000 | $701,000 | $3,361,000 |
| 2015 | $55,755 | $3,752,000 | $637,000 | $3,115,000 |
| 2014 | $73,564 | $4,743,000 | $1,143,000 | $3,600,000 |
Source: Public Records
Map
Nearby Homes
- 10 Eliot Rd
- 2 Beech Tree Ln
- 9 Pelham Rd
- 51 Bloomfield St
- 1 Tricorne Rd
- 65 Sherburne Rd S
- 1437 Massachusetts Ave
- 15 Slocum Rd
- 42 Winthrop Rd
- 1475 Massachusetts Ave Unit 467
- 3 Effie Place
- 48 Grapevine Ave
- 178 Waltham St
- 20 Maple St
- 25 Maple St
- 7 Baskin Rd
- 32 Forest St
- 1894 Massachusetts Ave
- 1900 Massachusetts Ave
- 34 Allen St
- 28 Eliot Rd
- 4 Bennington Rd
- 1 Bennington Rd
- 10 Bennington Rd
- 11 Bennington Rd
- 22 Washington St
- 32 Eliot Rd
- 16 Bennington Rd
- 15 Bennington Rd
- 29 Eliot Rd
- 27 Eliot Rd
- 22 Eliot Rd
- 43 Highland Ave
- 21 Washington St
- 40 Highland Ave
- 23 Bennington Rd
- 23 Eliot Rd
- 24 Bennington Rd
- 39 Highland Ave
- 38 Highland Ave
Your Personal Tour Guide
Ask me questions while you tour the home.