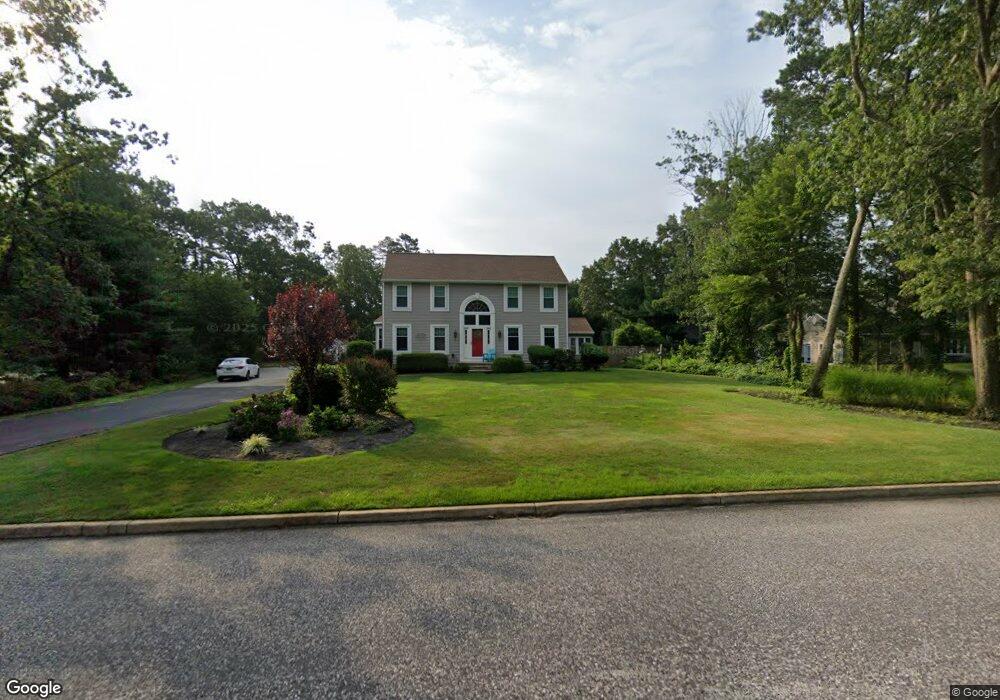
7 Berwyn Dr Ocean View, NJ 08230
Estimated Value: $686,000 - $739,000
5
Beds
3
Baths
2,714
Sq Ft
$259/Sq Ft
Est. Value
About This Home
This home is located at 7 Berwyn Dr, Ocean View, NJ 08230 and is currently estimated at $702,721, approximately $258 per square foot. 7 Berwyn Dr is a home located in Cape May County with nearby schools including Upper Township Primary School, Upper Township Elementary School, and Upper Township Middle School.
Ownership History
Date
Name
Owned For
Owner Type
Purchase Details
Closed on
Jun 25, 2008
Current Estimated Value
Home Financials for this Owner
Home Financials are based on the most recent Mortgage that was taken out on this home.
Original Mortgage
$250,000
Outstanding Balance
$57,177
Interest Rate
6.35%
Mortgage Type
Purchase Money Mortgage
Estimated Equity
$645,544
Purchase Details
Closed on
Aug 6, 1999
Sold by
Beattie Alan G
Bought by
Wisham Edmund L
Home Financials for this Owner
Home Financials are based on the most recent Mortgage that was taken out on this home.
Original Mortgage
$165,000
Interest Rate
7.54%
Purchase Details
Closed on
Sep 23, 1988
Sold by
Aldon Homes Inc
Bought by
Beattie Alan and Beattie Lois
Create a Home Valuation Report for This Property
The Home Valuation Report is an in-depth analysis detailing your home's value as well as a comparison with similar homes in the area
Home Values in the Area
Average Home Value in this Area
Purchase History
| Date | Buyer | Sale Price | Title Company |
|---|---|---|---|
| -- | $438,600 | -- | |
| Redmond Matthew | $438,550 | The Title Company Of Jersey | |
| Wisham Edmund L | $280,000 | -- | |
| Beattie Alan | $210,400 | -- |
Source: Public Records
Mortgage History
| Date | Status | Borrower | Loan Amount |
|---|---|---|---|
| Open | Redmond Matthew | $250,000 | |
| Previous Owner | Wisham Edmund L | $165,000 |
Source: Public Records
Tax History Compared to Growth
Tax History
| Year | Tax Paid | Tax Assessment Tax Assessment Total Assessment is a certain percentage of the fair market value that is determined by local assessors to be the total taxable value of land and additions on the property. | Land | Improvement |
|---|---|---|---|---|
| 2025 | $9,157 | $399,000 | $138,000 | $261,000 |
| 2024 | $9,157 | $399,000 | $138,000 | $261,000 |
| 2023 | $8,706 | $399,000 | $138,000 | $261,000 |
| 2022 | $8,387 | $399,000 | $138,000 | $261,000 |
| 2021 | $5,986 | $399,000 | $138,000 | $261,000 |
| 2020 | $7,777 | $399,000 | $138,000 | $261,000 |
| 2019 | $7,569 | $399,000 | $138,000 | $261,000 |
| 2018 | $7,370 | $399,000 | $138,000 | $261,000 |
| 2017 | $7,278 | $399,000 | $138,000 | $261,000 |
| 2016 | $7,110 | $383,300 | $138,000 | $245,300 |
| 2015 | $6,919 | $383,300 | $138,000 | $245,300 |
| 2014 | $6,711 | $455,900 | $218,800 | $237,100 |
Source: Public Records
Map
Nearby Homes