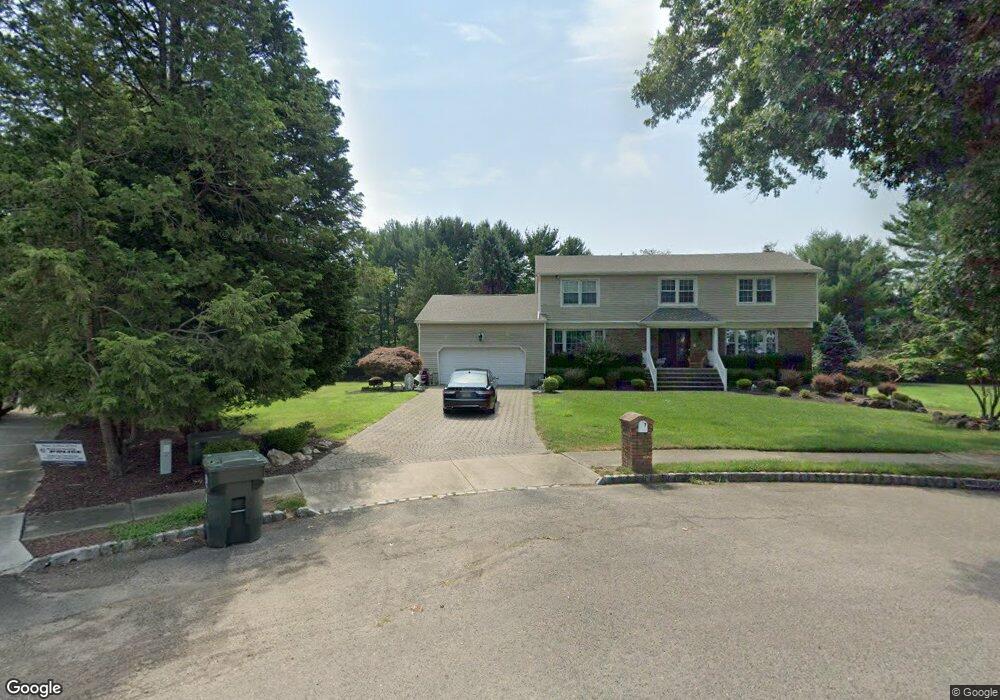
7 Birch Ct Marlboro, NJ 07746
Estimated Value: $1,074,560 - $1,375,000
5
Beds
2
Baths
3,894
Sq Ft
$305/Sq Ft
Est. Value
About This Home
This home is located at 7 Birch Ct, Marlboro, NJ 07746 and is currently estimated at $1,187,140, approximately $304 per square foot. 7 Birch Ct is a home located in Monmouth County with nearby schools including Asher Holmes Elementary School, Marlboro Middle School, and Marlboro High School.
Ownership History
Date
Name
Owned For
Owner Type
Purchase Details
Closed on
Feb 22, 2018
Bought by
Brower Robert John
Current Estimated Value
Home Financials for this Owner
Home Financials are based on the most recent Mortgage that was taken out on this home.
Original Mortgage
$60,000
Outstanding Balance
$51,328
Interest Rate
4.4%
Estimated Equity
$1,135,812
Purchase Details
Closed on
Feb 24, 1992
Bought by
Brower Robert J and Brower Erin P
Create a Home Valuation Report for This Property
The Home Valuation Report is an in-depth analysis detailing your home's value as well as a comparison with similar homes in the area
Home Values in the Area
Average Home Value in this Area
Purchase History
| Date | Buyer | Sale Price | Title Company |
|---|---|---|---|
| Brower Robert John | -- | -- | |
| Brower Robert J | $265,000 | -- |
Source: Public Records
Mortgage History
| Date | Status | Borrower | Loan Amount |
|---|---|---|---|
| Open | Brower Robert John | $60,000 | |
| Closed | Brower Robert John | -- |
Source: Public Records
Tax History Compared to Growth
Tax History
| Year | Tax Paid | Tax Assessment Tax Assessment Total Assessment is a certain percentage of the fair market value that is determined by local assessors to be the total taxable value of land and additions on the property. | Land | Improvement |
|---|---|---|---|---|
| 2025 | $15,555 | $623,700 | $187,200 | $436,500 |
| 2024 | $14,869 | $623,700 | $187,200 | $436,500 |
| 2023 | $14,869 | $623,700 | $187,200 | $436,500 |
| 2022 | $14,489 | $623,700 | $187,200 | $436,500 |
| 2021 | $14,345 | $623,700 | $187,200 | $436,500 |
| 2020 | $14,339 | $623,700 | $187,200 | $436,500 |
| 2019 | $14,345 | $623,700 | $187,200 | $436,500 |
| 2018 | $14,102 | $623,700 | $187,200 | $436,500 |
| 2017 | $13,827 | $623,700 | $187,200 | $436,500 |
| 2016 | $13,771 | $623,700 | $187,200 | $436,500 |
| 2015 | $13,572 | $624,000 | $187,200 | $436,800 |
| 2014 | $12,658 | $575,900 | $157,200 | $418,700 |
Source: Public Records
Map
Nearby Homes
- 9 Bennett Ct
- 21 Alberta Dr
- 10 Brunswick Dr
- 46 S Foxcroft Dr
- 20 Calgary Cir
- 126 Wyncrest Rd
- 4 Terrace Dr
- 23 Eli Cir
- 3 Sugar Maple Ave
- 308 Pilot St
- 102 Pilot St
- 121 Peasley Dr
- 69 Caldwell Terrace
- 21 Wickatunk Rd
- 45 Regina Rd
- 39 Homestead Cir
- 39 Longstreet Rd
- 10 Locust Grove Ln
- 12 Locust Grove Ln
- 1 Wickatunk Rd