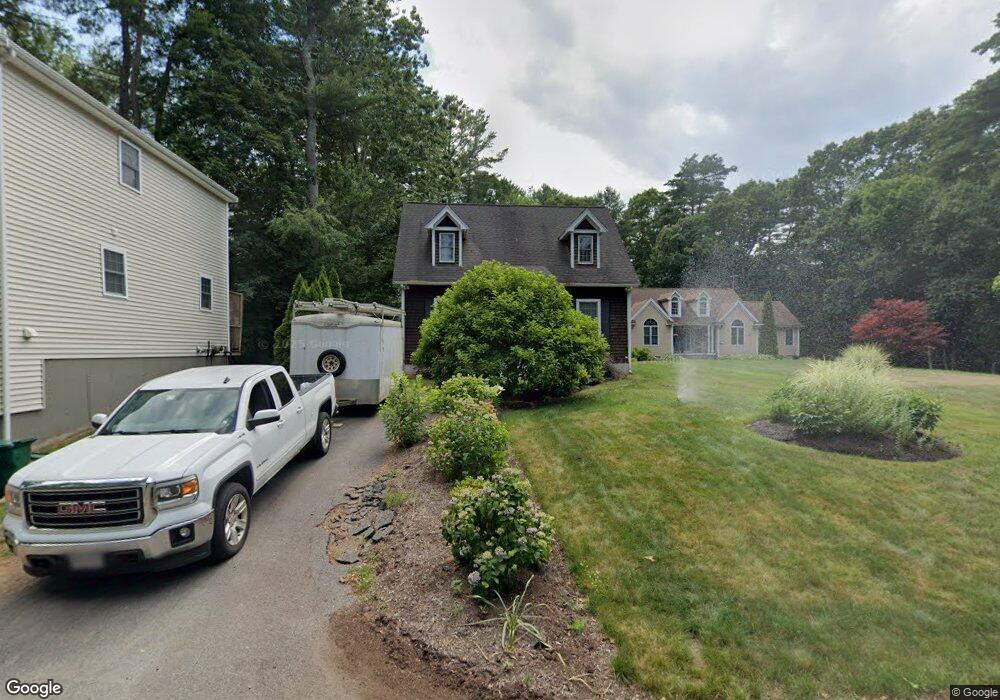
7 Birch Rd Halifax, MA 02338
Estimated Value: $532,053 - $601,000
3
Beds
2
Baths
1,578
Sq Ft
$366/Sq Ft
Est. Value
About This Home
This home is located at 7 Birch Rd, Halifax, MA 02338 and is currently estimated at $577,763, approximately $366 per square foot. 7 Birch Rd is a home located in Plymouth County with nearby schools including Silver Lake Regional High School, Halifax Elementary School, and Silver Lake Regional Middle School.
Ownership History
Date
Name
Owned For
Owner Type
Purchase Details
Closed on
Feb 14, 2022
Sold by
Conroy Jennifer
Bought by
Conroy Melvin T and Conroy John
Current Estimated Value
Home Financials for this Owner
Home Financials are based on the most recent Mortgage that was taken out on this home.
Original Mortgage
$288,000
Outstanding Balance
$267,632
Interest Rate
3.92%
Mortgage Type
New Conventional
Estimated Equity
$310,131
Purchase Details
Closed on
Mar 11, 2011
Sold by
Conroy Jason
Bought by
Conroy Jennifer
Home Financials for this Owner
Home Financials are based on the most recent Mortgage that was taken out on this home.
Original Mortgage
$234,825
Interest Rate
4.87%
Mortgage Type
FHA
Purchase Details
Closed on
Sep 1, 2004
Sold by
Conroy Melvin
Bought by
Conroy Jason
Create a Home Valuation Report for This Property
The Home Valuation Report is an in-depth analysis detailing your home's value as well as a comparison with similar homes in the area
Home Values in the Area
Average Home Value in this Area
Purchase History
| Date | Buyer | Sale Price | Title Company |
|---|---|---|---|
| Conroy Melvin T | -- | None Available | |
| Conroy Melvin T | -- | None Available | |
| Conroy Melvin T | -- | None Available | |
| Conroy Jennifer | $250,000 | -- | |
| Conroy Jason | -- | -- | |
| Conroy Jennifer | $250,000 | -- | |
| Conroy Jason | -- | -- |
Source: Public Records
Mortgage History
| Date | Status | Borrower | Loan Amount |
|---|---|---|---|
| Open | Conroy Melvin T | $288,000 | |
| Closed | Conroy Melvin T | $288,000 | |
| Previous Owner | Conroy Jason | $233,966 | |
| Previous Owner | Conroy Jennifer | $234,825 | |
| Previous Owner | Conroy Jason | $220,000 |
Source: Public Records
Tax History
| Year | Tax Paid | Tax Assessment Tax Assessment Total Assessment is a certain percentage of the fair market value that is determined by local assessors to be the total taxable value of land and additions on the property. | Land | Improvement |
|---|---|---|---|---|
| 2025 | $6,967 | $488,200 | $158,200 | $330,000 |
| 2024 | $6,817 | $473,400 | $152,100 | $321,300 |
| 2023 | $6,736 | $452,700 | $147,600 | $305,100 |
| 2022 | $6,532 | $408,000 | $131,800 | $276,200 |
| 2021 | $6,224 | $357,900 | $126,700 | $231,200 |
| 2020 | $5,884 | $337,400 | $126,700 | $210,700 |
| 2019 | $5,767 | $330,100 | $123,100 | $207,000 |
| 2018 | $5,440 | $308,200 | $110,300 | $197,900 |
| 2017 | $5,426 | $292,800 | $110,300 | $182,500 |
| 2016 | $5,313 | $276,000 | $103,100 | $172,900 |
| 2015 | $5,277 | $277,900 | $103,100 | $174,800 |
Source: Public Records
Map
Nearby Homes
- 1 Poplar Rd
- 528 Twin Lakes Dr
- 37 Annawon Dr
- 25 Lawrence Rd
- 0 Thompson St
- 4 Upton St
- 0 Union Park St
- 115 Waltham St
- 151 Plymouth St Unit 151A
- 102 Leon Ct
- 343 Monponsett St
- 3 Natureway Cir
- 20 Forestdale Dr
- 8 10th Ave
- 820 Center St
- The Drift Plan at Featherwinds
- 265 Monponsett St Unit 2210
- The Expanded Cloud Plan at Featherwinds
- The Cirrus Plan at Featherwinds
- 265 Monponsett St Unit 2203
Your Personal Tour Guide
Ask me questions while you tour the home.